Biomed / 08
RSPO1–LGR5–PTPRM in NPC metastasis
Integrates single-cell transcriptomics, clinical specimens and functional experiments to examine how RSPO1⁺ CAFs activate the LGR5–β-catenin/TCF4–PTPRM axis, disrupt vascular integrity and promote NPC metastasis, with further evaluation of QPH-FR as an inhibitor. Submitted to Cancer Research and under review; I am a coauthor.
- Publication status
- Under review
- Submitted to
- Cancer Research
Abstract
Distant metastasis remains the principal cause of mortality in nasopharyngeal carcinoma (NPC), yet the microenvironmental signals that coordinate tumor stemness and vascular remodeling remain poorly defined. Here, we integrated single-cell transcriptomic analyses with clinical and functional validation to identify a stromal-driven metastatic program. We identified a transcriptionally distinct LGR5+ epithelial subpopulation in primary NPC that exhibited elevated cancer stem cell-like signature and metastatic potential that were significantly correlated with poor clinical outcomes.
LGR5 depletion impaired self-renewal but did not measurably reduce migration or invasion in vitro, suggesting that additional microenvironmental signals were required for metastatic competence. Unexpectedly, we found a unique type of RSPO1+ cancer-associated fibroblast (CAF) subpopulation that secreted R-spondin 1, which paracrinally activated the adjacent LGR5+ tumor cells. This engagement triggered β-catenin nuclear translocation and subsequent TCF4-mediated transcriptional upregulation of PTPRM, a receptor-type protein tyrosine phosphatase in tumor cells. Strikingly, Molecular proximity ligation assay (PLA) and biochemical immunoprecipitation identified trans-homophilic interaction between tumor cell-derived PTPRM and endothelial PTPRM, which resulted in significant vascular disruption.
Genetic perturbations of PTPRM from either tumor or endothelial cells can significantly impact vascular structure and function in independent co-culture models. QPH-FR, a targeted small-peptide inhibitor of the RSPO1–LGR5 interface, effectively dampened the signaling cascade, preserved vascular integrity, and potently suppressed systemic metastatic burden in preclinical models. Collectively, our work revealed that a stroma-tumor crosstalk mechanism mediated by the RSPO1–LGR5–β-catenin/TCF4–PTPRM axis, which potently drives NPC vascular remodeling and metastasis, providing a rationale for niche-targeted therapeutic intervention in metastatic NPC.
Figures
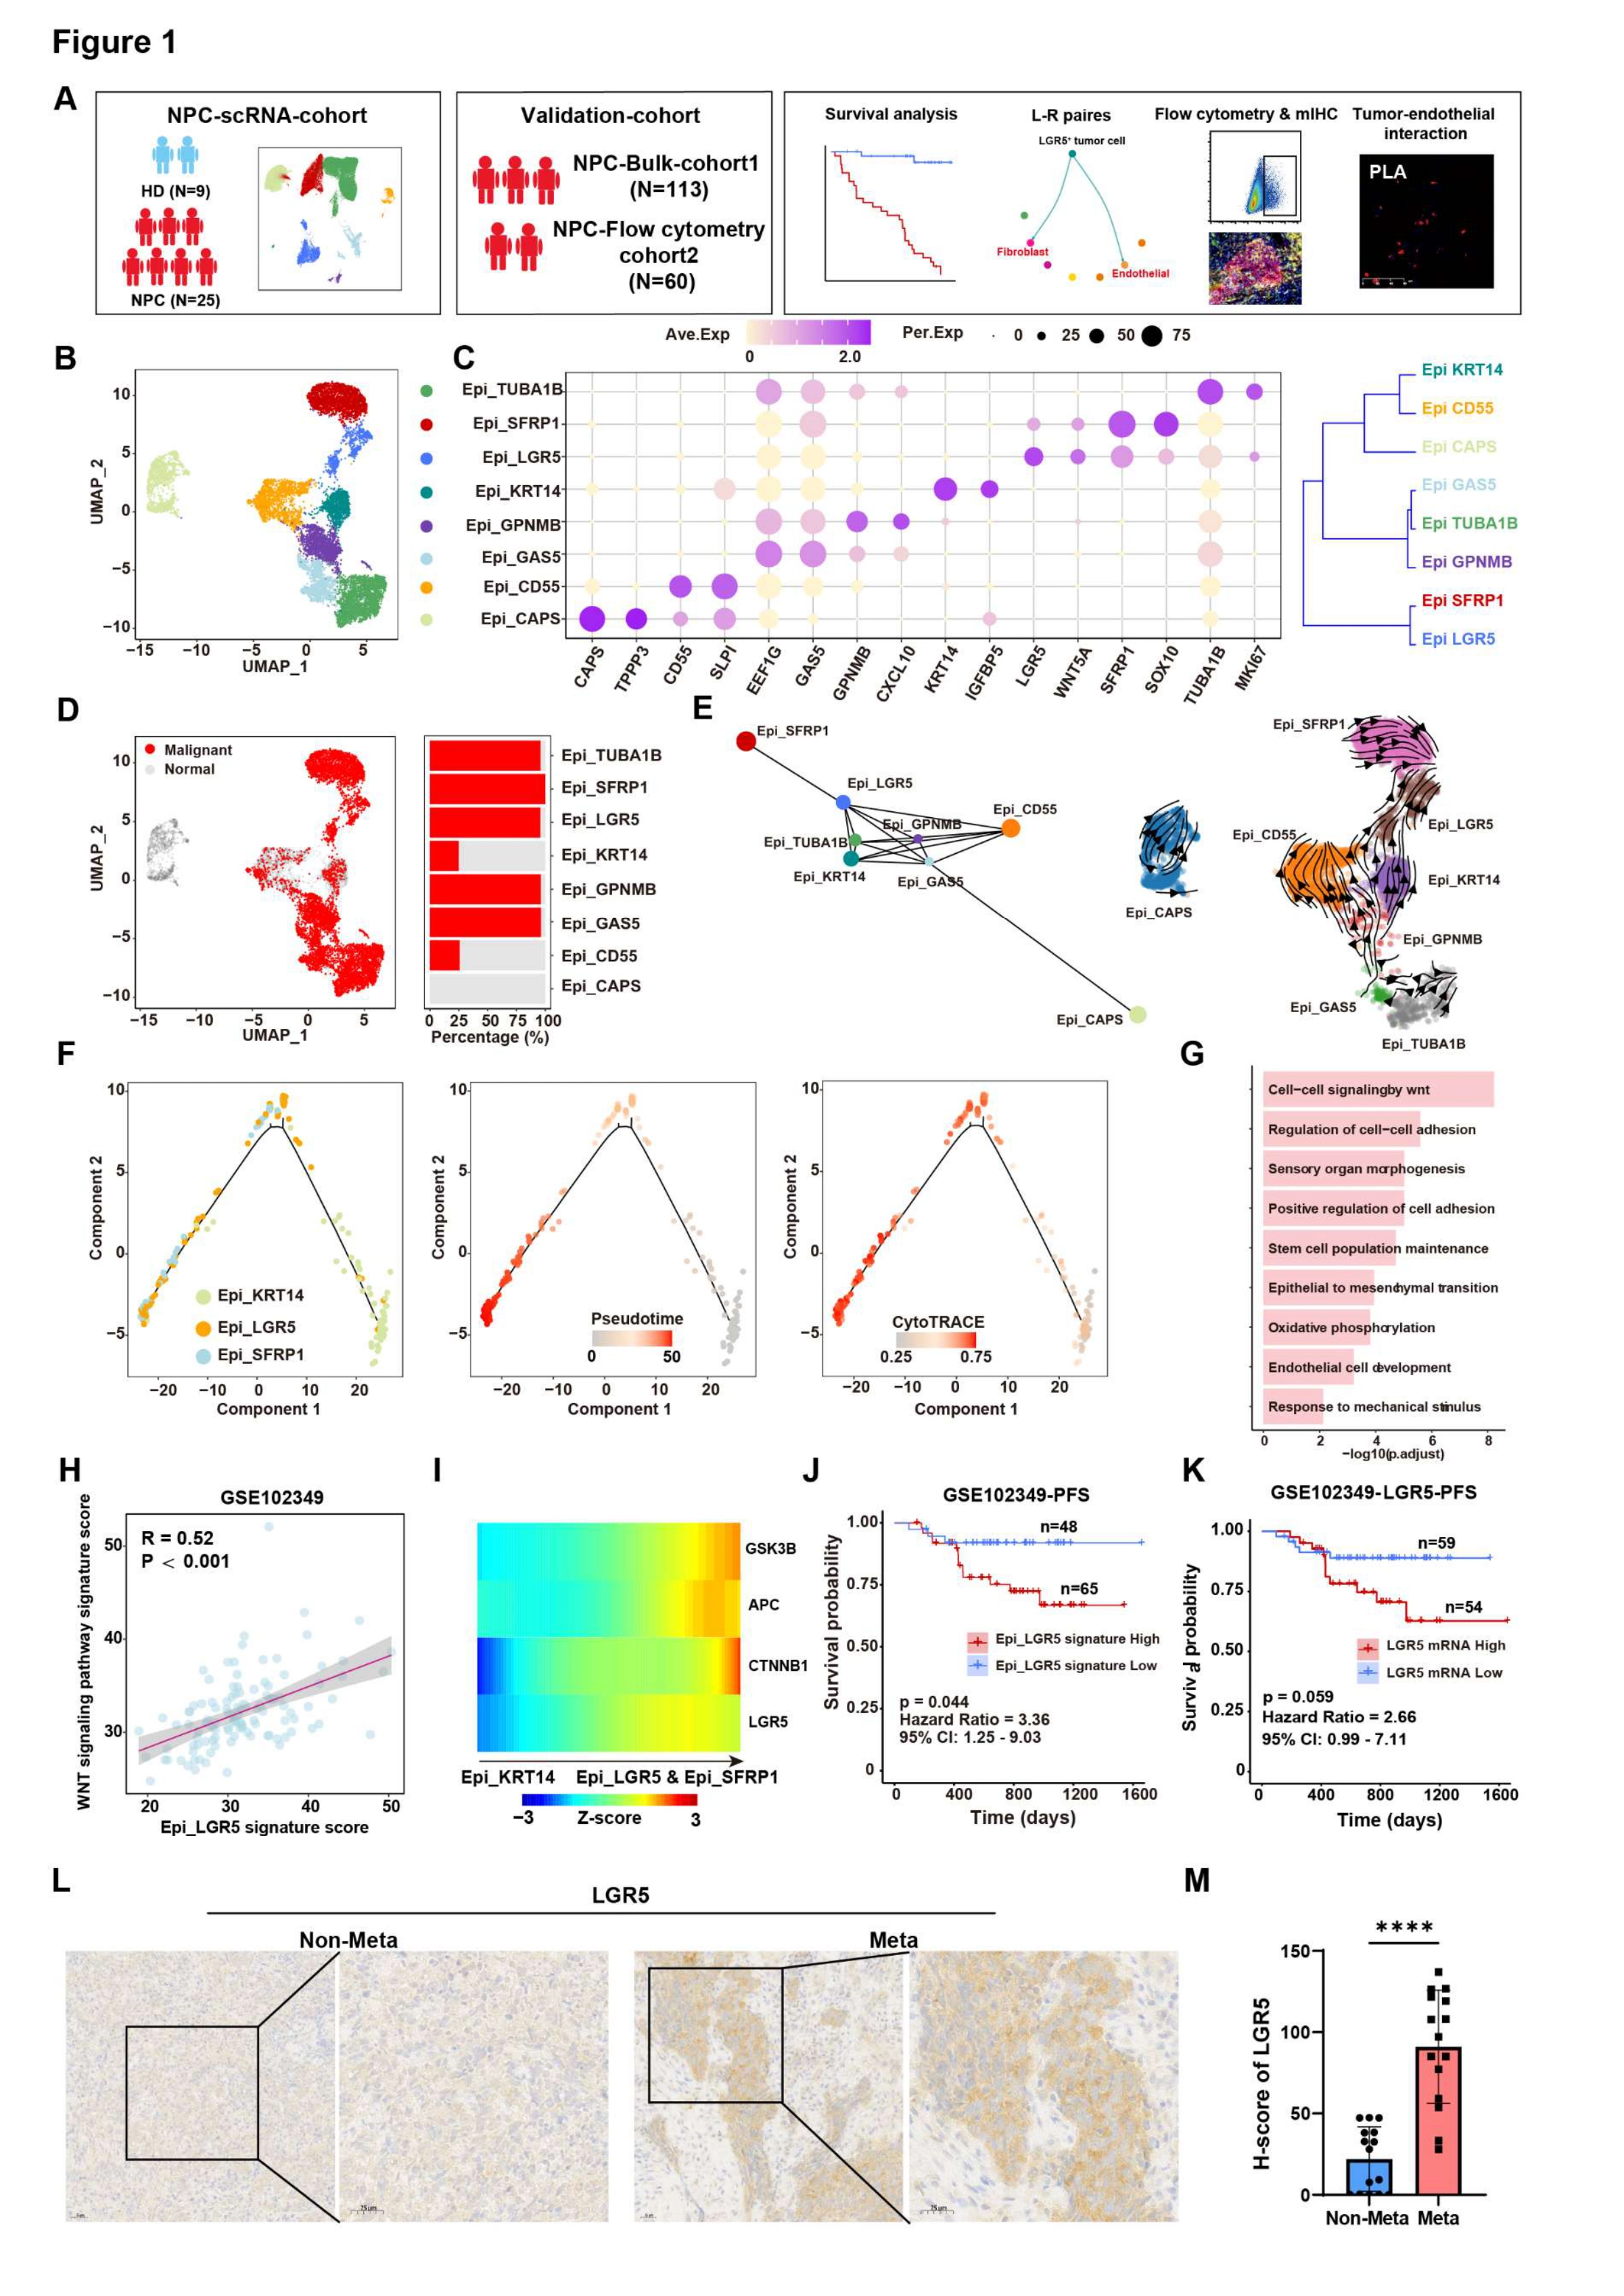
Identification of a cancer stem cell (CSC)-like LGR5+ epithelial subpopulation in primary NPC
The study first asks which NPC tumor-cell population should be followed into the metastatic mechanism. A–D establish epithelial states and malignant identity, E–I connect the LGR5-positive population to differentiation, WNT and adhesion programs, and J–M examine its clinical and tissue context.
ADefine discovery and validation
Schematic illustration of the study design and workflow, including single-cell RNA sequencing (scRNA-seq) of primary NPC and normal tissues, validation in independent bulk cohorts, and clinical survival analysis. This separates discovery from cohort validation, so the later argument does not rest on clustering alone.
BLocate the candidate population
Uniform Manifold Approximation and Projection (UMAP) plot of eight epithelial subpopulations. Each dot indicates a single cell. Color‐coded for clusters. Locate the LGR5 population within the epithelial atlas; subsequent comparisons repeatedly return to this population.
CAttach biological identity to clusters
Dot plot of marker genes for epithelial subpopulations. Dot size represents the fraction of expressing cells, and color represents normalized expression. The markers give the clusters in B biological meaning rather than treating different colors as distinct mechanisms.
DSeparate malignant from nonmalignant cells
UMAP plot showing malignant (red) from non-malignant (gray) epithelial cells inferred from copy-number variation (CNV) inference (left) and the malignant-cell fraction in each epithelial subpopulation (right). This identity check precedes the stem-like interpretation and distinguishes tumor-associated states from normal epithelium.
EInfer relationships between states
Trajectory analysis of Epithelial subpopulations was performed by PAGA (left) and velocyto (right). The focus is on inferred connections and direction; these trajectories are not direct lineage tracing.
FResolve the differentiation comparison
Pseudotime trajectory of Epi_KRT14, Epi_LGR5, and Epi_SFRP1 cells (left), CytoTRACE scores (middle), and pseudotime scores (right). The three states are compared within a common differentiation framework, sharpening the rationale for focusing on Epi_LGR5.
GNominate WNT and adhesion programs
Gene-set enrichment analysis showing WNT signaling and cell–cell adhesion programs enriched in Epi_LGR5 cells. This moves from cell identity to candidate programs that motivate the later signaling and vascular-contact experiments.
HCheck the association in another cohort
Correlation between Epi_LGR5 and WNT-pathway signature scores in the validation cohort. Together with G, this asks whether the association is also visible in an independent data setting.
IInspect individual pathway components
Heatmap of normalized expression (Z-score) of key WNT pathway components (GSK3B, CTNNB1, LGR5, APC) in Epi_LGR5 and Epi_SFRP1 clusters compared to other epithelial subtypes. Individual genes help explain which expression patterns underlie the pathway-level comparison.
JRelate the population signature to outcome
Kaplan-Meier analysis of progression-free survival (PFS) in an independent validation cohort (GSE102349) stratified by high (n=48) and low (n=65) Epi_LGR5 signature scores. P = 0.044 by log-rank test. This evaluates the outcome association of a population signature, not the isolated effect of one gene.
KDistinguish gene and signature readouts
Kaplan-Meier survival analysis of patients stratified by high (n=59) and low (n=54) LGR5 mRNA expression levels. p = 0.059 by log-rank test. Placed beside J, this shows why LGR5 expression and the full population signature should not be treated as equivalent readouts.
L-MReturn the finding to tissue
Representative LGR5 IHC images (L) and H-score quantification (M) in primary NPC from non-metastatic NPC patients and metastatic NPC patients (n = 15 per group). Scale bars, 25μm. P values were calculated using a two-tailed Student’s t-test. **** P<0.0001. Representative staining and quantification test whether a corresponding LGR5 difference is observable in patient tissue.
Takeaway
This figure turns an atlas label into a population worth investigating mechanistically. Transcriptional features, survival associations and tissue staining provide complementary—not interchangeable—evidence. Figure 2 therefore asks which stromal cells might supply signals to these LGR5-positive tumor cells.
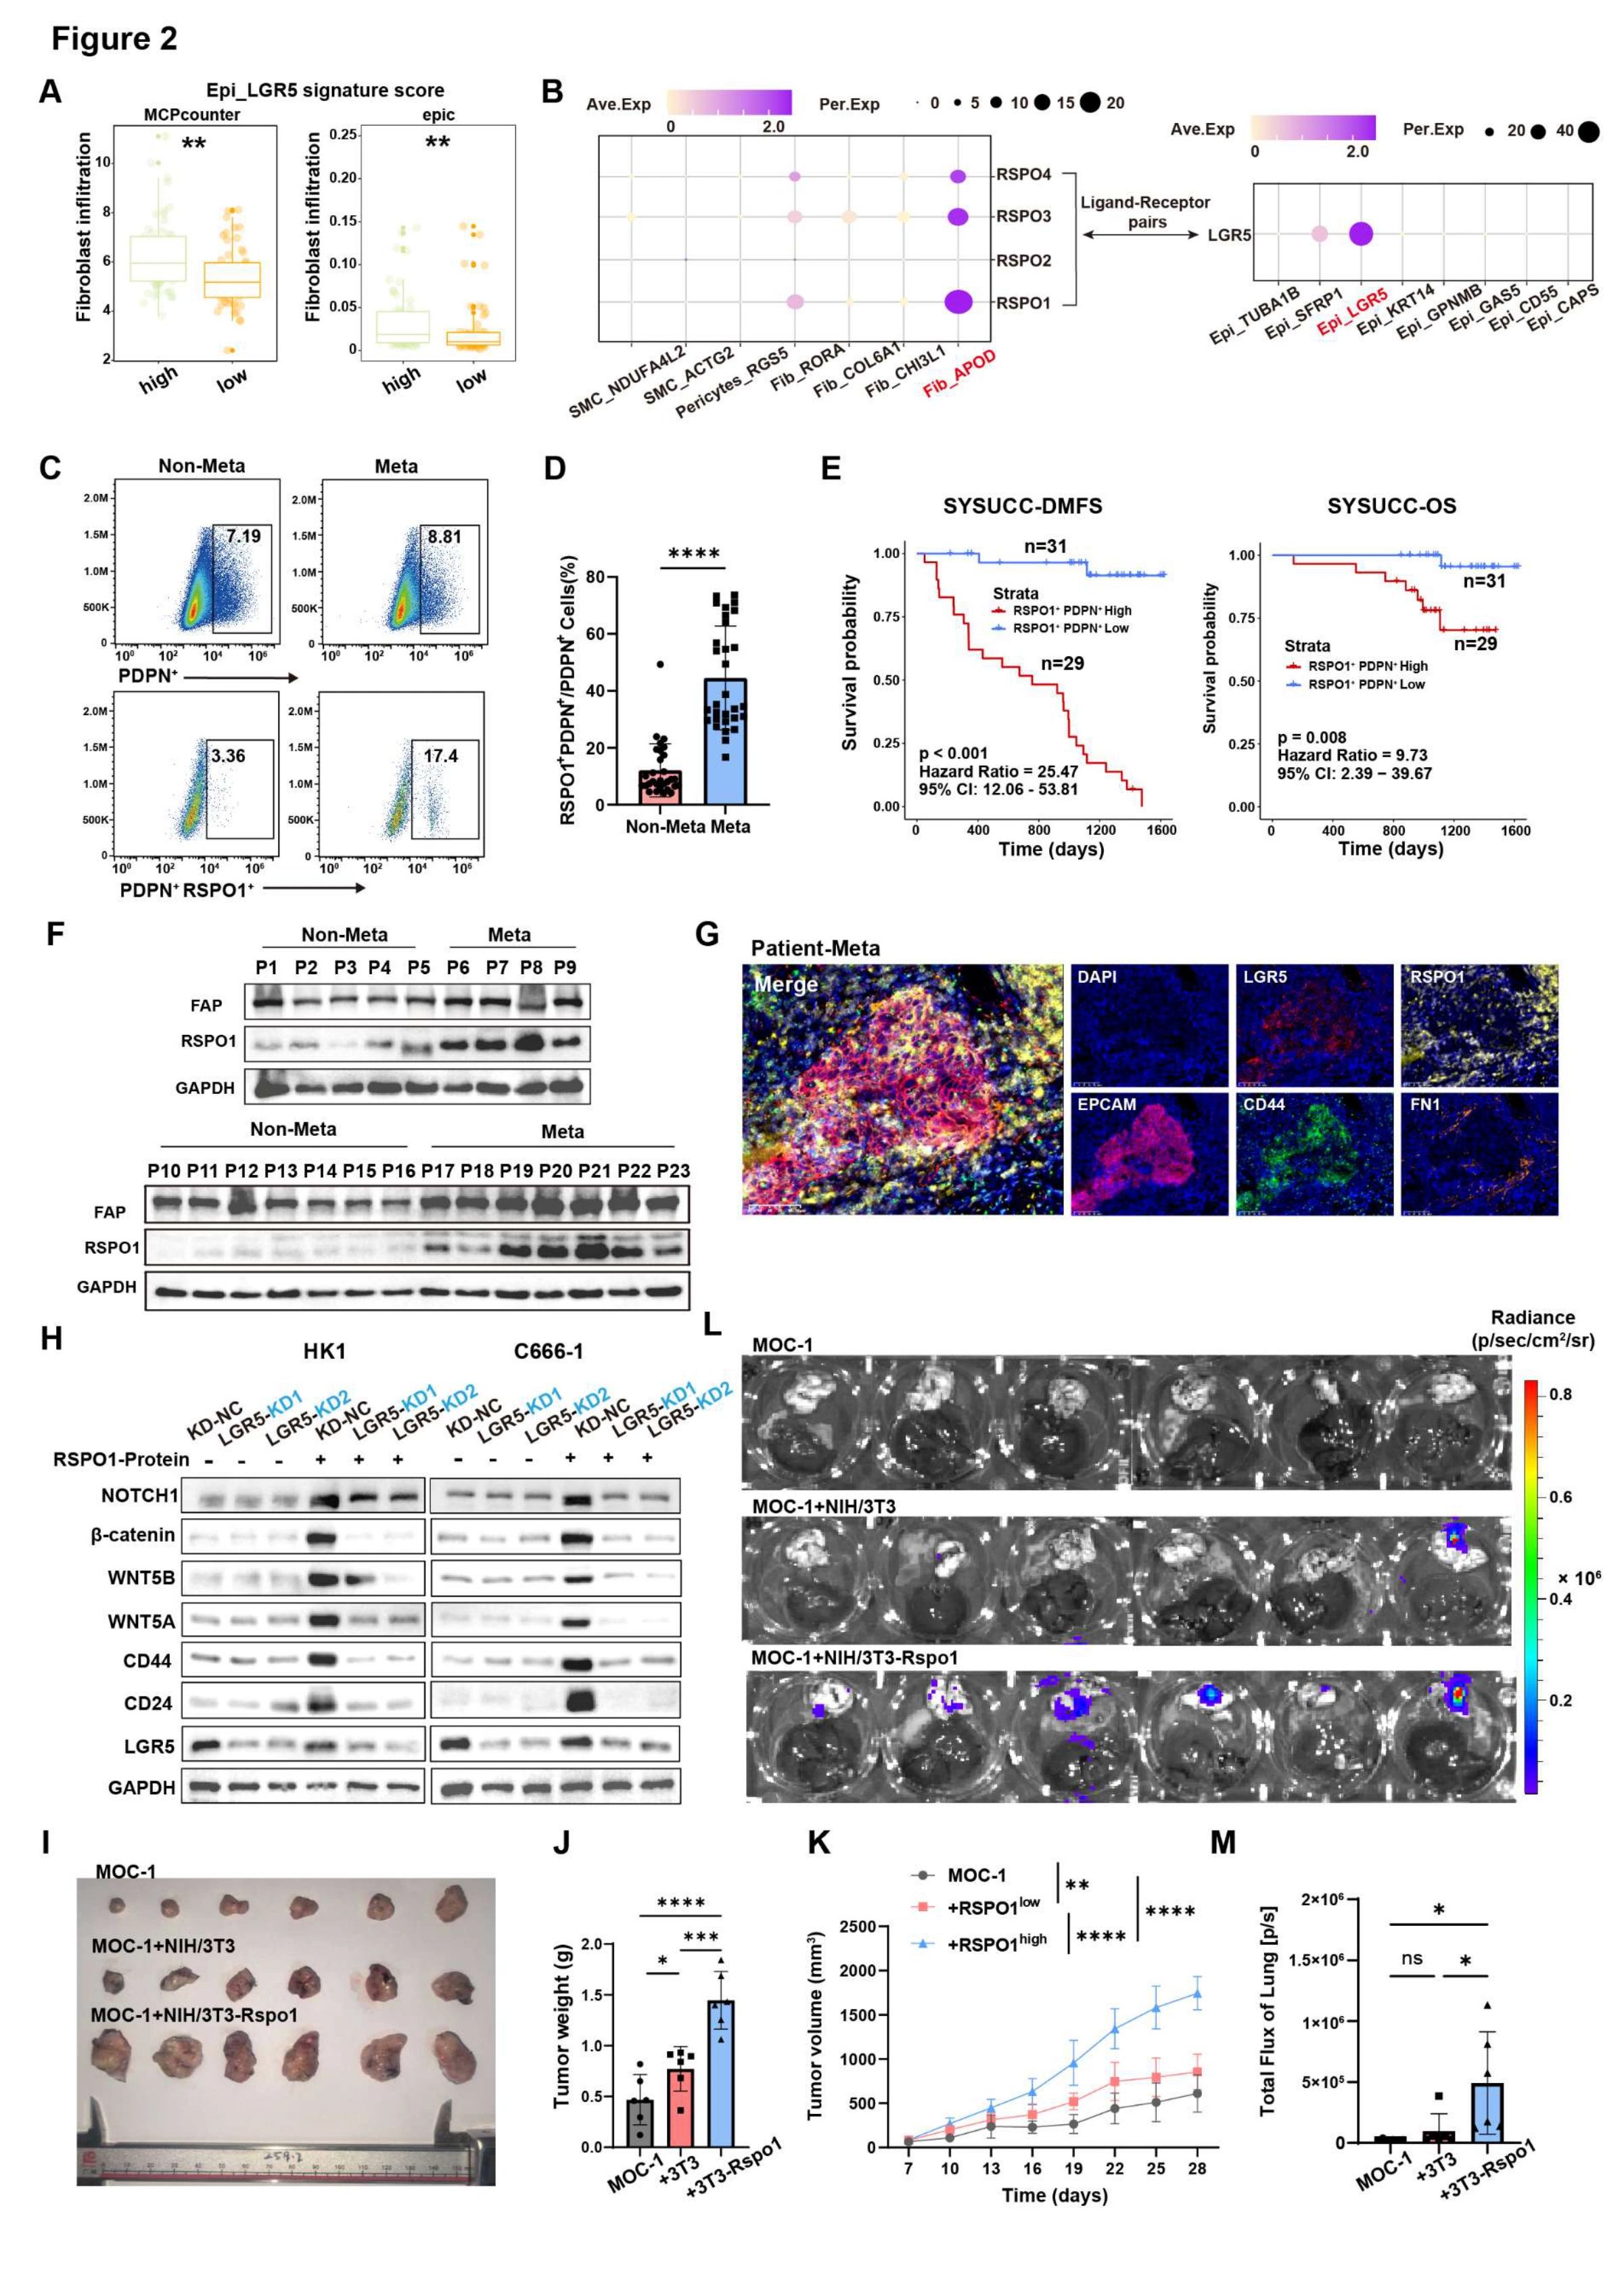
RSPO1+CAFs promote LGR5-dependent tumor growth and metastatic dissemination
After identifying the LGR5-positive tumor population, this figure asks where its signals originate. A–G investigate RSPO1-positive CAFs through stromal associations, ligand–receptor predictions and patient specimens; H tests the tumor-cell response, and I–M extend the question to growth and dissemination in vivo.
ALook for a stromal sender
Fibroblast infiltration estimated with MCP-counter (left) and EPIC (right) in NPC tumors with high or low Epi_LGR5 scores. ** P < 0.01 by two-tailed Student’s t-test. This asks whether a stronger LGR5 signature accompanies a fibroblast signal before proposing a specific interaction.
BNominate the RSPO1–LGR5 pair
Predicted ligand–receptor interactions between fibroblast and epithelial subpopulations. Dot size represents the fraction of expressing cells, and color represents Z score-normalized expression. Arrows indicate the predicted RSPO1–LGR5 pair. The prediction narrows the candidates; the following specimen and perturbation experiments supply the validation.
C, DCount RSPO1-positive CAFs in specimens
Representative flow cytometry plots (C) and quantification (D) showing the percentage of PDPN+RSPO1+ fibroblasts in primary NPC from metastatic patients compared to non-metastatic controls (n = 30 per group). ****P < 0.0001 by two-tailed Student’s t-test. Measuring the candidate sender population brings the prediction in B into patient-derived cellular evidence.
ERelate CAF abundance to outcome
Kaplan–Meier analysis of distant metastasis-free survival (left) and overall survival (right) in the SYSUCC cohort stratified by the fraction of RSPO1+PDPN+ cells among total PDPN+ fibroblasts (n = 60; cutoff, 23.9%). P values were calculated using the log- rank test. This addresses clinical association, without by itself establishing that CAF abundance causes metastasis.
FCharacterize patient-derived CAF cultures
Immunoblotting of FAP and RSPO1 in CAF cultures derived from non-metastatic (P1–P5 and P10–P16) or metastatic (P6–P9 and P17–P23) primary NPC. GAPDH was the loading control. Protein measurements also characterize the CAF models used in subsequent RSPO1-dependent experiments.
GInspect the tissue context of both partners
Representative mIHC in primary NPC from metastatic patients DAPI (blue), LGR5 (red), RSPO1 (yellow), EPCAM (purple), CD44 (green) and FN1 (orange). Channels are shown individually and merged. Magnification, 40×; scale bars, 50 μm. The merged image places stromal and tumor markers in the same tissue context rather than comparing bulk abundance alone.
HTest receptor-dependent tumor responses
Western blot analysis was performed to assess the levels of canonical stemness markers (CD44, CD24, NOTCH1), key WNT pathway effectors (β-catenin, WNT5A, WNT5B), and LGR5 protein in HK1 and C666-1 cells after recombinant RSPO1 treatment and/or LGR5 depletion. Combining RSPO1 stimulation with LGR5 depletion tests whether the nominated receptor is required for the downstream response.
IIntroduce the stromal signal in vivo
Representative photographs of subcutaneous tumors harvested from C57BL/6 mice injected in the right flank with MOC-1 cells alone (1×10^6 cells), MOC-1 plus control NIH/3T3 cells (1 × 10⁵), or MOC-1 plus Rspo1-overexpressing NIH/3T3 cells. Tumor-only and the two fibroblast co-injection conditions establish the in vivo comparison.
JCompare endpoint tumor burden
Tumor weight (n = 6 mice per group). Data are the mean ± SD. P values were calculated using one-way ANOVA. *P < 0.05, **P < 0.01, and ***P < 0.001. Endpoint weight provides a group-level measurement alongside the representative tumors in I.
KAdd the growth time course
Tumor growth over 28 days (n = 6 mice per group). Data are the mean ± SD. P values were calculated using two-way ANOVA. **P < 0.01 and ****P < 0.0001. The curves show how group differences develop over time rather than only at the endpoint.
LInspect dissemination to distant organs
IVIS images of lung and liver bioluminescence. The radiance scale is photons/s. This shifts the question from local tumor growth to tumor-associated signals in distant organs.
MQuantify the imaging comparison
Quantification of total photon flux in the lungs of each group. Data are presented as mean ± SD. ns, no significance, * P < 0.05 by one-way ANOVA. Read with L, retaining the distinction between significant and nonsignificant comparisons indicated in the figure.
Takeaway
The figure links a candidate sender, the RSPO1-positive CAF, to a receiver, the LGR5-positive tumor cell, and adds perturbation and in vivo readouts to the correlations. Figure 3 then asks how this interaction relates to the vascular barrier used during dissemination.
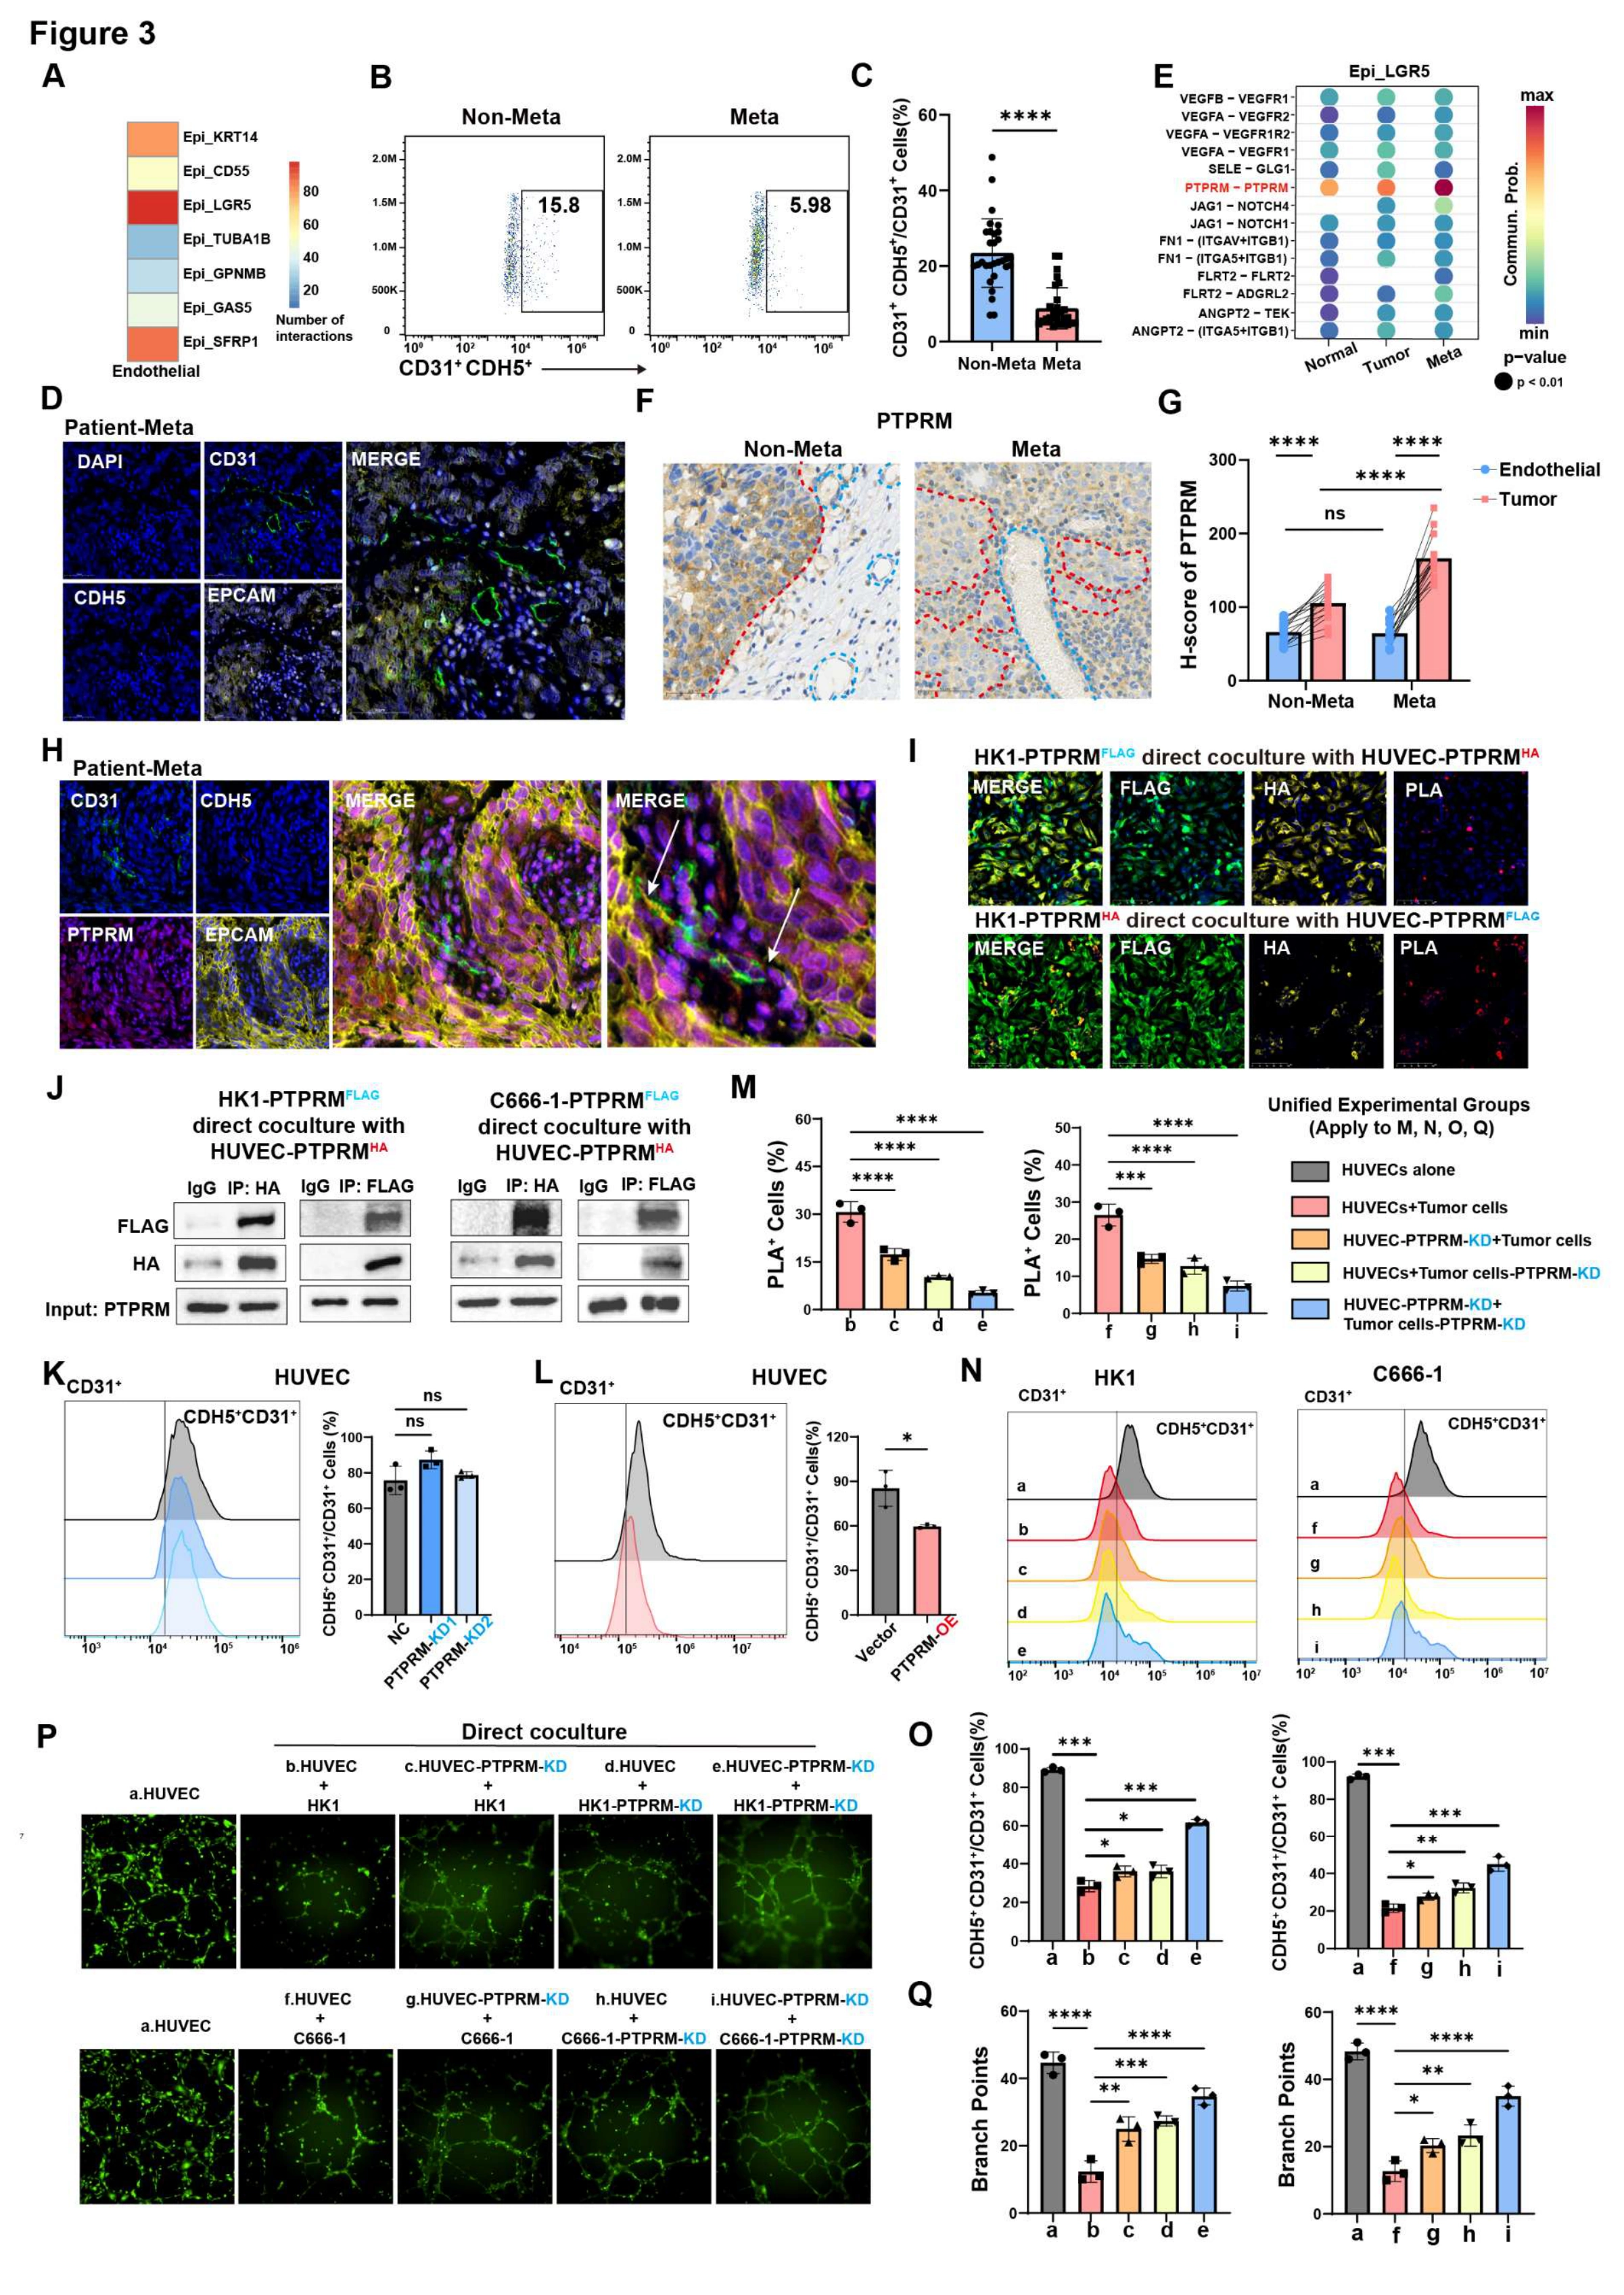
LGR5+ tumor cells disrupt vascular integrity via PTPRM-mediated heterotypic tumor-endothelial adhesion
The focus now shifts from stromal–tumor signaling to tumor–endothelial contact. A–H nominate PTPRM and examine the patient vascular context; I–J test molecular proximity and association, and K–Q use compartment-specific perturbations to connect contact with endothelial junction and tube-formation readouts.
ANominate endothelial interactions
Predicted cell–cell communication between Epi_LGR5 and endothelial populations. The prediction extends the investigation from tumor-cell properties to potentially affected vascular cells.
B, CMeasure endothelial junction-marker status
Representative flow cytometry plots (B) and quantification (C) showing a reduced proportion of junction-intact endothelial cells (CD31+ CDH5+) in primary tumors from metastatic patients (Meta) compared with non-metastatic (Non-Meta) controls (n = 30 per group). This provides a patient-sample reference for the junction-marker readout used later in culture.
DLocate junction changes in tissue
Representative mIHC images of NPC clinical specimens showing DAPI (blue), EPCAM (yellow), CD31 (green), and CDH5 (orange). Each stain was shown separately and merged. Magnification, 40×; scale bars, 50 μm. Spatial staining complements the cellular proportions by placing the markers within vascular structures.
ESelect a candidate contact molecule
Predicted ligand–receptor interaction analysis of PTPRM–PTPRM interaction between Epi_LGR5 cells and endothelial cells in primary tumors from metastatic patients and non-metastatic. PTPRM–PTPRM becomes a testable contact hypothesis rather than a mechanism established by prediction alone.
F-GExamine both cellular compartments
Representative PTPRM IHC (F) and compartment-specific quantification (G) in primary NPC (n = 15 per group). Red and blue dashed outlines indicate tumor and endothelial regions, respectively. Scale bars, 50μm. P values were calculated using two-tailed Student’s t-test and paired t-test. ns, no significance. ****P < 0.0001. Compartment-specific quantification distinguishes tumor expression from changes in the endothelium.
HInspect the tissue interface
Representative images of mIHC of CD31 and CDH5 in metastatic primary NPC clinical specimens. DAPI (blue), EPCAM (yellow), CD31 (green) and CDH5 (orange). Each stain was shown separately and merged. Magnification, 40×; scale bars, 50μm. Read the separate channels and merged view together to relate tumor location to endothelial junction markers.
ITest molecular proximity
PLA in direct co-cultures of HK1 cells and HUVECs expressing differentially tagged PTPRM (FLAG and HA). Cells were stained for DAPI (blue), FLAG (green), HA (yellow) , and PLA signals (red). Dual-tag PLA adds proximity evidence to colocalization and is interpreted alongside association and functional assays.
JAdd biochemical association evidence
Co-immunoprecipitation after direct co-culture of tumor cells expressing PTPRM– FLAG and HUVECs expressing PTPRM-HA. This complements I by testing whether the differently tagged PTPRM proteins associate after co-culture.
KEstablish the endothelial baseline
Flow cytometric analysis and quantification of CD31⁺CDH5⁺ endothelial cells in control and PTPRM-knockdown HUVEC monocultures. Data are presented as mean ± SD. ns, no significance, by one-way ANOVA. Depletion without tumor cells helps distinguish an endothelial-autonomous effect from a contact-dependent effect.
LProbe the opposite perturbation
Flow cytometric analysis and quantification of CD31⁺CDH5⁺ endothelial cells in control and PTPRM-overexpressing HUVECs. Data are presented as mean ± SD. *P < 0.05 by two-tailed Student’s t-test. Overexpression complements K; its effect need not be a perfectly symmetric inverse of depletion.
MPerturb both sides of the interface
Quantification of PLA signals in direct tumor–endothelial co-cultures after PTPRM depletion in tumor cells, HUVECs, or both compartments. Tumor-side, endothelial-side and combined depletion test which compartments the contact signal depends on.
N, OConnect contact to junction markers
Representative flow-cytometry ridgeline plots (N) and quantification (O) of CD31⁺CDH5⁺ HUVECs under the indicated direct co-culture conditions. Data are presented as the mean ± SD. * P < 0.05, ** P < 0.01, and *** P < 0.001 calculated using one-way ANOVA. The defined perturbations connect molecular contact with a barrier-associated endothelial phenotype.
P, QExtend the test to network formation
Representative tube-formation images (P) and quantification of branch points (Q) under the indicated conditions. Data are presented as the mean ± SD. P values were calculated using one-way ANOVA. * P < 0.05, ** P < 0.01, *** P < 0.001 and **** P < 0.0001. Experimental conditions (a-i): a. HUVECs only; b. HUVECs direct coculture with HK1 cells; c. PTPRM-depleted HUVECs direct coculture with HK1 cells; d. HUVECs direct coculture with PTPRM-depleted HK1 cells; e, PTPRM-depleted HUVECs direct coculture with PTPRM-depleted HK1 cells; f, HUVECs direct coculture with C666-1 cells; g, PTPRM-depleted HUVECs direct coculture with C666-1 cells; h, HUVECs direct coculture with PTPRM-depleted C666-1 cells; i, PTPRM-depleted HUVECs direct coculture with PTPRM-depleted C666-1 cells. Tube formation complements marker measurements; retain the a–i distinctions between cell lines and perturbation compartments.
Takeaway
The evidence progresses from clinical co-occurrence to contact assays and functional perturbations, supporting a PTPRM-linked tumor–endothelial mechanism. Figure 4 asks whether the RSPO1-positive CAF signal established earlier feeds into this same mechanism.
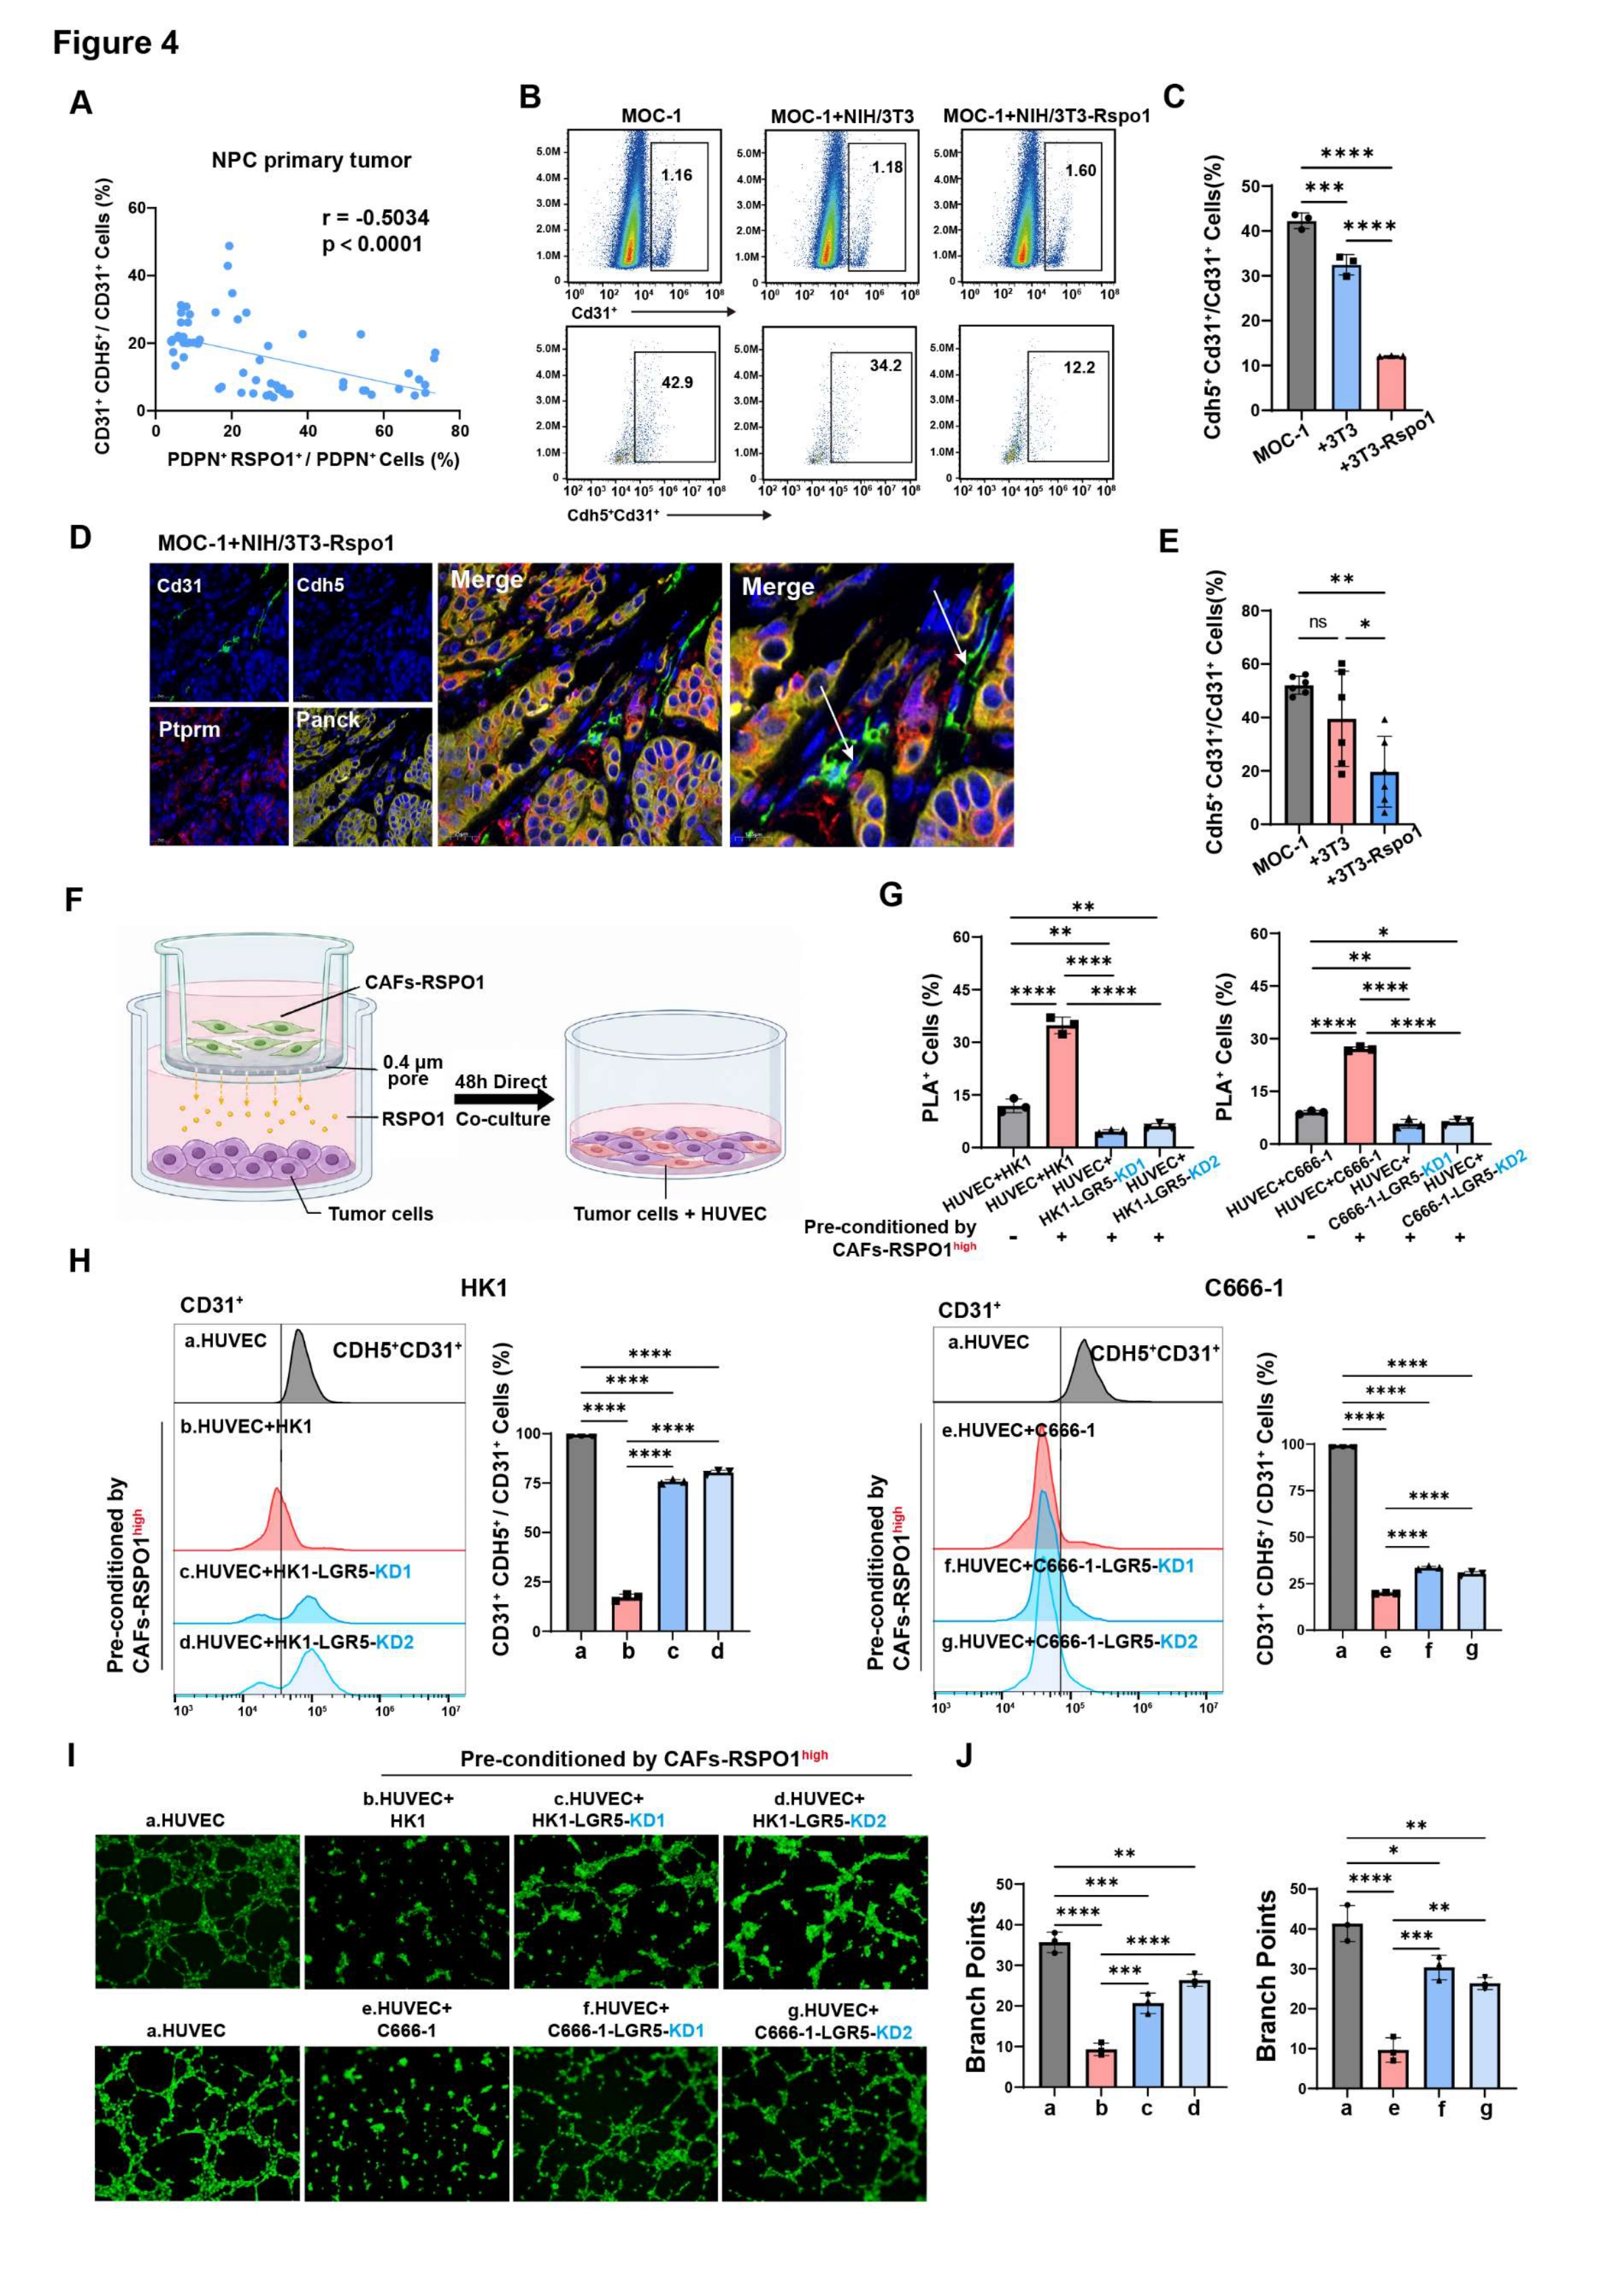
RSPO1⁺ CAFs drive vascular barrier breakdown via paracrine activation of tumor-derived LGR5 signaling
This figure joins the preceding observations: do RSPO1-positive CAFs first alter tumor cells, which then affect the endothelium? A–E examine the connection in patient and mouse tissue. The two-step system in F separates stromal conditioning from direct endothelial contact, and G–J test the relay with LGR5 depletion.
ACheck the patient-level association
Correlation between PDPN+ RSPO1+ fibroblasts and junction-intact endothelial cells (CD31+CDH5+) in primary NPC (n=60). Comparing CAF and endothelial measurements within the same patient series supplies clinical context for the relay model.
B, CRevisit the link in co-injected tumors
Representative flow cytometry plots (B) and quantification (C) of Cd31+Cdh5+ endothelial cells in subcutaneous MOC-1 tumors alone or with control or Rspo1-overexpressing NIH/3T3 fibroblasts (n = 3 per group). Data are presented as the mean ± SD. ***P < 0.001 and ****P < 0.0001 by one-way ANOVA. This tests whether changing the fibroblast condition is accompanied by altered endothelial junction markers in vivo.
D, EConnect flow measurements to tissue structure
Representative mIHC (D) and quantification (E) of DAPI (blue), Panck (yellow), Cd31 (green), Ptprm (red) and Cdh5 (orange) in MOC-1 + NIH/3T3-Rspo1 tumors. Arrows indicate fragmented vascular networks with disrupted junctional architecture mediated by PTPRM. Magnification, 40× or 80×; scale bars, 25 μm. Data are presented as the mean ± SD. ns, no significance, *P < 0.05 and **P < 0.01 by one- way ANOVA. Flow proportions and local vascular architecture offer complementary measurements of the barrier-associated change.
FSeparate the two experimental stages
Schematic illustration of the two-step co-culture model: NPC cells were indirectly co-cultured with RSPO1-high CAFs for 48 h and then directly co-cultured with HUVECs. Conditioning before direct contact is central to testing tumor cells as the intermediate relay.
GMeasure contact after conditioning
PLA-signal quantification after HUVECs were directly co-cultured with control or LGR5-depleted HK1/C666-1 cells that had been preconditioned with RSPO1-high CAFs. Data are presented as the mean ± SD. P values were calculated using one-way ANOVA. * P < 0.05, ** P < 0.01, *** P < 0.001 and **** P < 0.0001. Keeping CAF conditioning while depleting tumor-cell LGR5 tests receptor dependence of the subsequent contact signal.
HRead the downstream endothelial response
Flow-cytometry analysis and quantification of CD31+CDH5+ endothelial cells under indicated conditions. **** P < 0.0001 calculated using one-way ANOVA. Paired with G, this links the contact readout to its endothelial consequence.
I, JExtend junction readouts to tube formation
Representative Calcein-AM-stained tube-formation images (I) and branch-point quantification under indicated conditions (J). Data are presented as the mean ± SD. P values were calculated using one-way ANOVA. * P < 0.05, ** P < 0.01, *** P < 0.001 and **** P < 0.0001. Experimental conditions (a-g): a, HUVECs alone; b, HUVECs plus HK1 cells preconditioned with RSPO1-high CAFs; c, HUVECs plus LGR5-KD1 HK1 cells preconditioned with RSPO1-high CAFs; d, HUVECs plus LGR5-KD2 HK1 cells preconditioned with RSPO1-high CAFs; e, HUVECs plus C666-1 cells preconditioned with RSPO1-high CAFs; f, HUVECs plus LGR5-KD1 C666-1 cells preconditioned with RSPO1-high CAFs; g, HUVECs plus LGR5-KD2 C666-1 cells preconditioned with RSPO1-high CAFs. Two NPC cell lines and two depletion conditions allow the same relay logic to be examined across comparisons.
Takeaway
The two-step model is the logical center: it tests stromal input, tumor-cell reception and endothelial output in sequence. Figure 5 then examines the intervening tumor-cell mechanism connecting LGR5 signaling to PTPRM expression.
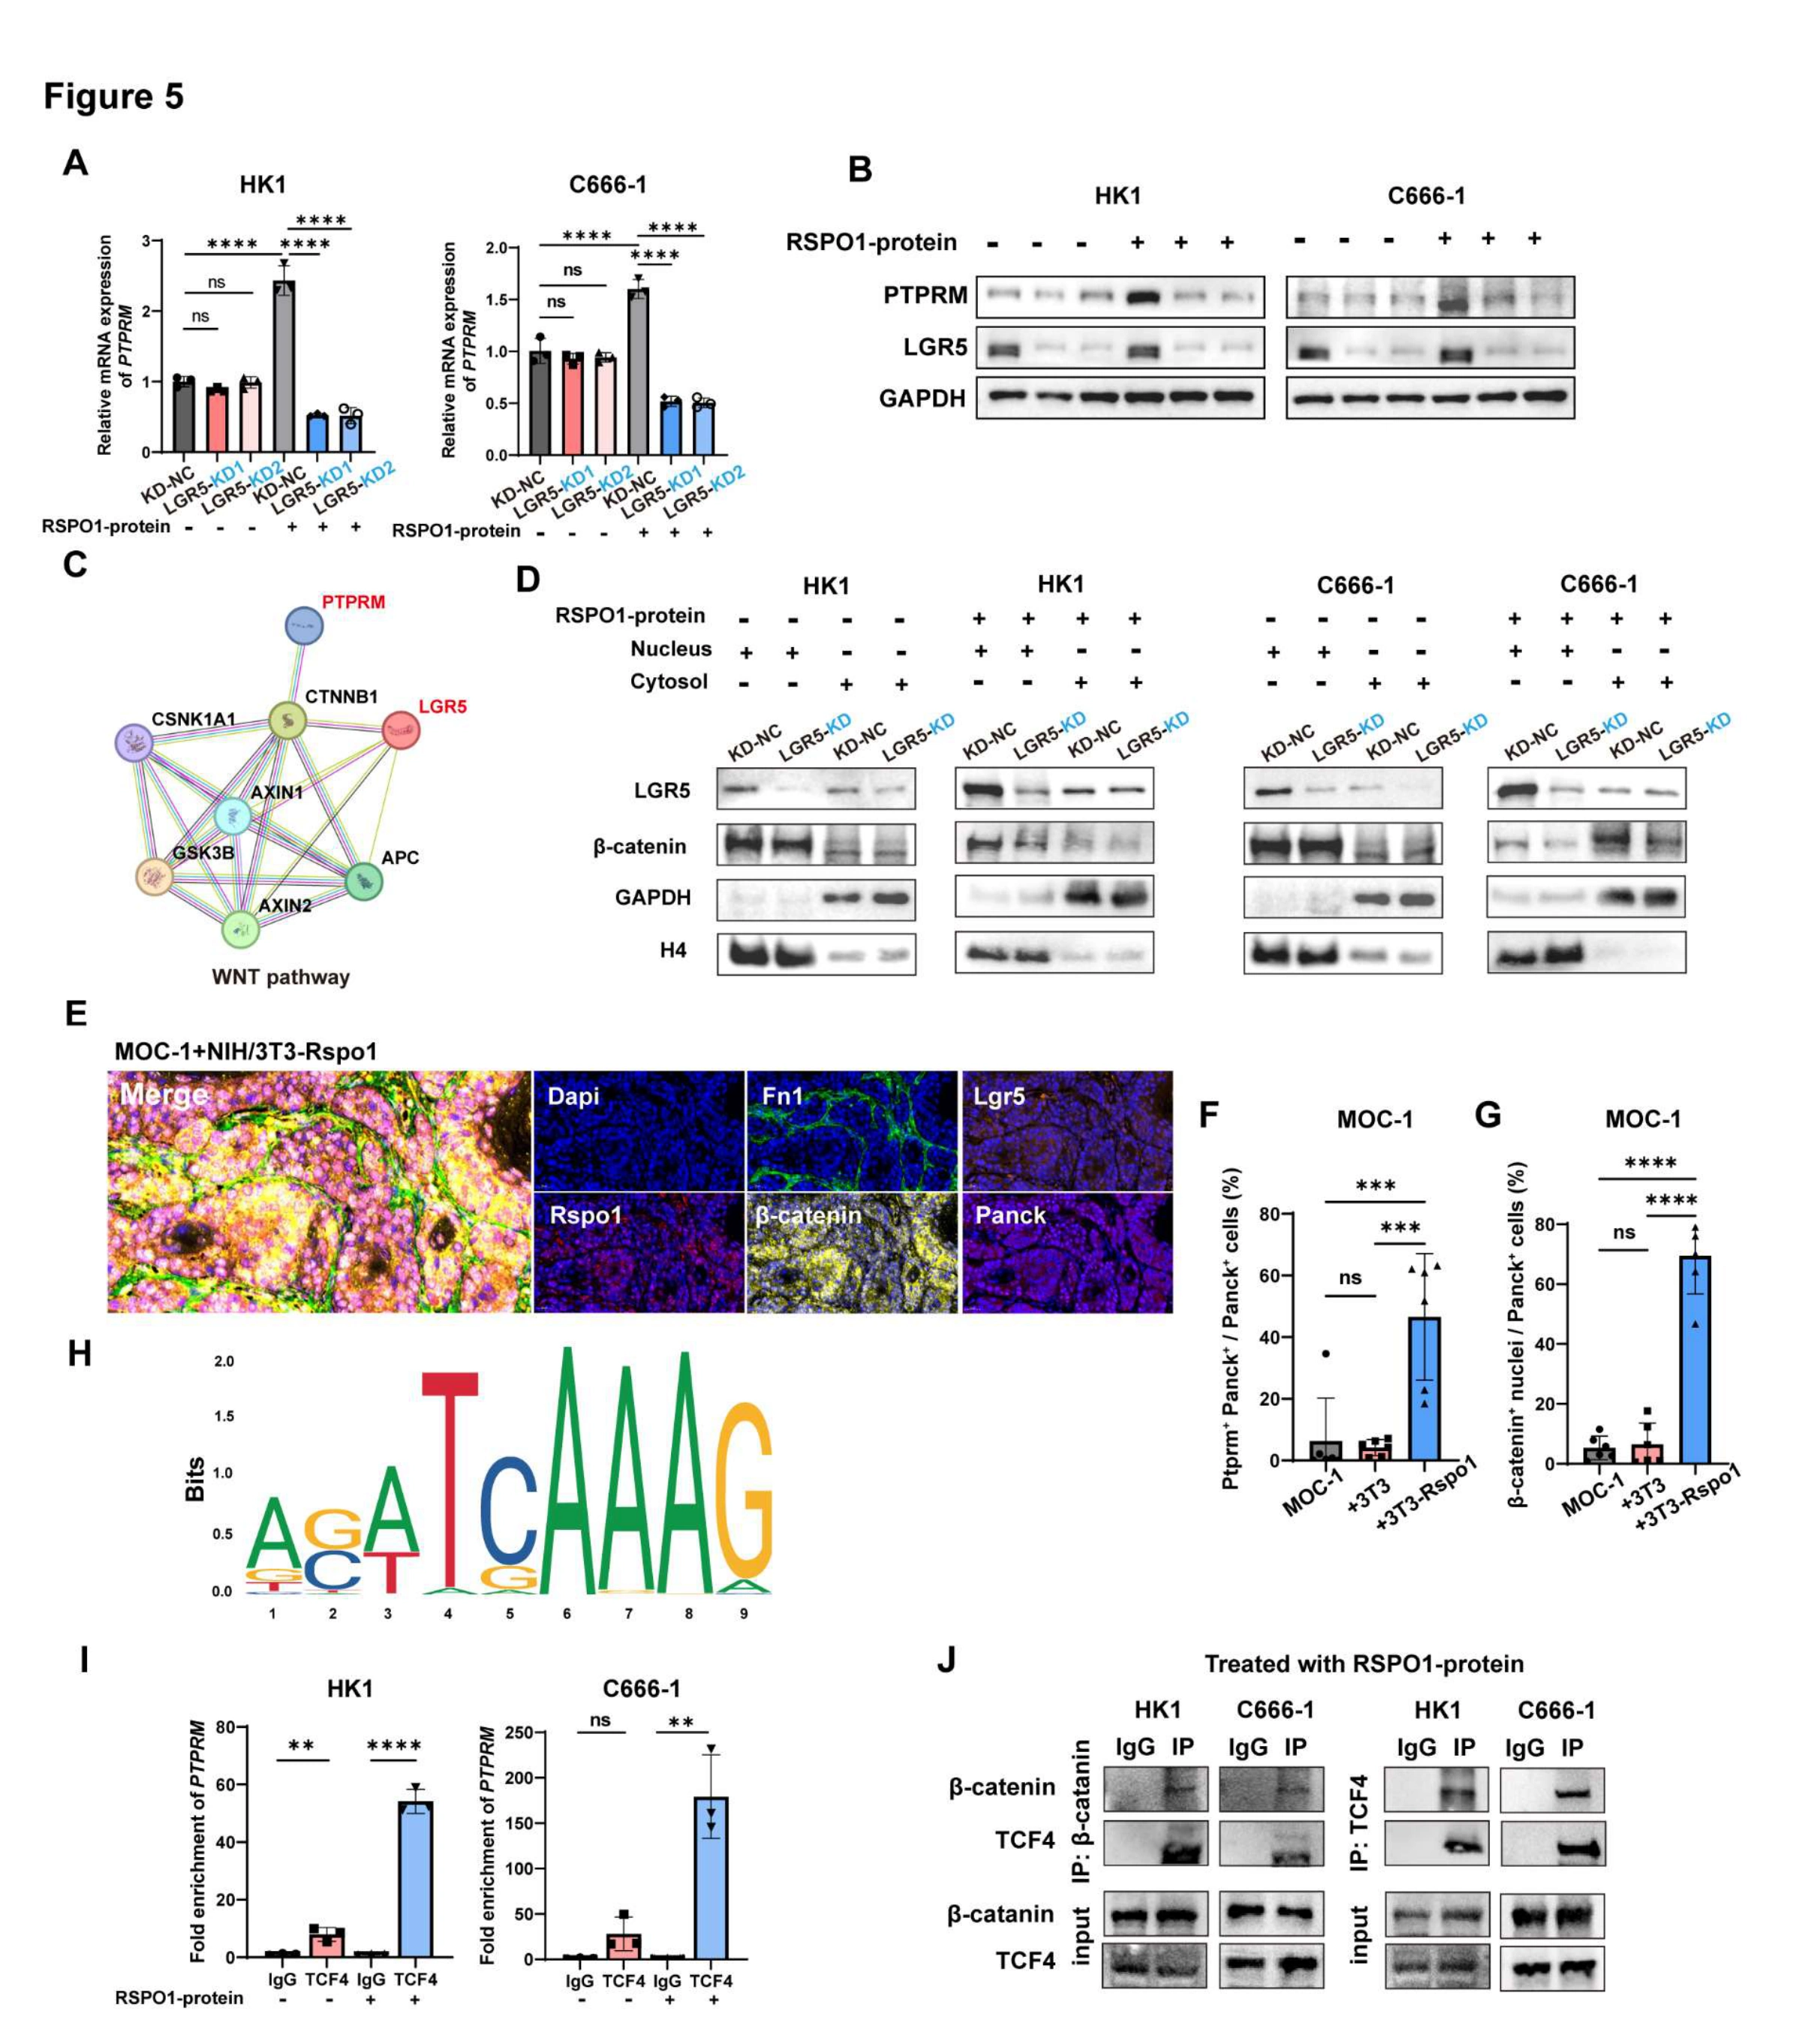
RSPO1–LGR5 signaling drives PTPRM transcription via β- catenin/TCF4 complex assembly in tumor cells
This figure examines the intracellular link between the stromal input and vascular phenotype. A–B test PTPRM expression after RSPO1/LGR5 perturbation, C–G investigate β-catenin and its nuclear localization, and H–J connect the proposed pathway to the PTPRM promoter and the β-catenin/TCF4 complex.
AMeasure the transcript response
PTPRM mRNA in HK1 and C666-1 cells treated with recombinant RSPO1 with or without LGR5 depletion. Data are presented as the mean ± SD. ns, no significance. **** P < 0.0001 using one-way ANOVA. Stimulation with receptor depletion separates the treatment response from its LGR5 dependence.
BCheck the protein-level counterpart
Western blot analysis of PTPRM and LGR5 protein levels corresponding to (A). Read with A to assess whether the transcript response is also reflected in the contact protein.
CNominate the intracellular connection
Protein-interaction network nominating CTNNB1 (β-catenin) as a potential link between LGR5-associated WNT signaling and PTPRM regulation. The network nominates a route that subsequent localization and association experiments test.
DDistinguish localization from abundance
Nuclear and cytosolic β-catenin after RSPO1 treatment and LGR5 depletion. GAPDH and H4 was the cytosolic and nuclear loading control. Nuclear–cytosolic separation asks where β-catenin accumulates, not merely whether total protein changes.
EReturn the intracellular model to tissue
Representative mIHC of subcutaneous tumors from MOC-1 cells co-injected with RSPO1-overexpressing NIH/3T3 fibroblasts. DAPI (blue), Fn1 (green), Rspo1 (red), Lgr5 (orange), β-catenin (yellow), and Panck (purple). Each stain was shown separately and merged. Magnification, 40×; scale bars, 25 μm. The tissue view places stromal origin, tumor identity and β-catenin within a common in vivo context.
F, GQuantify nuclear signaling and PTPRM
Quantification of nuclear β-catenin-positive tumor cells (F) and Ptprm+ Panck+ tumor cells (G) derived from mIHC analysis. Data are presented as the mean ± SD. P values were calculated using one-way ANOVA. ns, no significance, *** P < 0.001 and **** P < 0.0001. The two measurements connect an intermediate signal and its proposed output within tissue.
HLocate a promoter hypothesis
JASPAR-predicted TCF4 motif in the PTPRM promoter. The motif supplies a candidate location for ChIP rather than establishing binding by itself.
ITest promoter occupancy
ChIP-qPCR analysis showing significantly enhanced enrichment of TCF4 on the PTPRM promoter upon RSPO1 treatment compared to untreated controls. P values were calculated using two-tailed Student’s t-test. ns, no significance, ** P < 0.01 and **** P < 0.0001. The stimulation comparison advances H from a sequence prediction to experimental occupancy evidence.
JTest association of the regulatory complex
Co-immunoprecipitation (Co-IP) of β-catenin and TCF4 after RSPO1 stimulation. Read with I: one assay measures promoter occupancy, the other association between regulatory proteins.
Takeaway
RNA, protein, nuclear localization and promoter-occupancy measurements build the proposed RSPO1–LGR5–β-catenin/TCF4–PTPRM regulatory chain. Figure 6 asks whether intervention with QPH-FR can alter the corresponding metastatic phenotype.
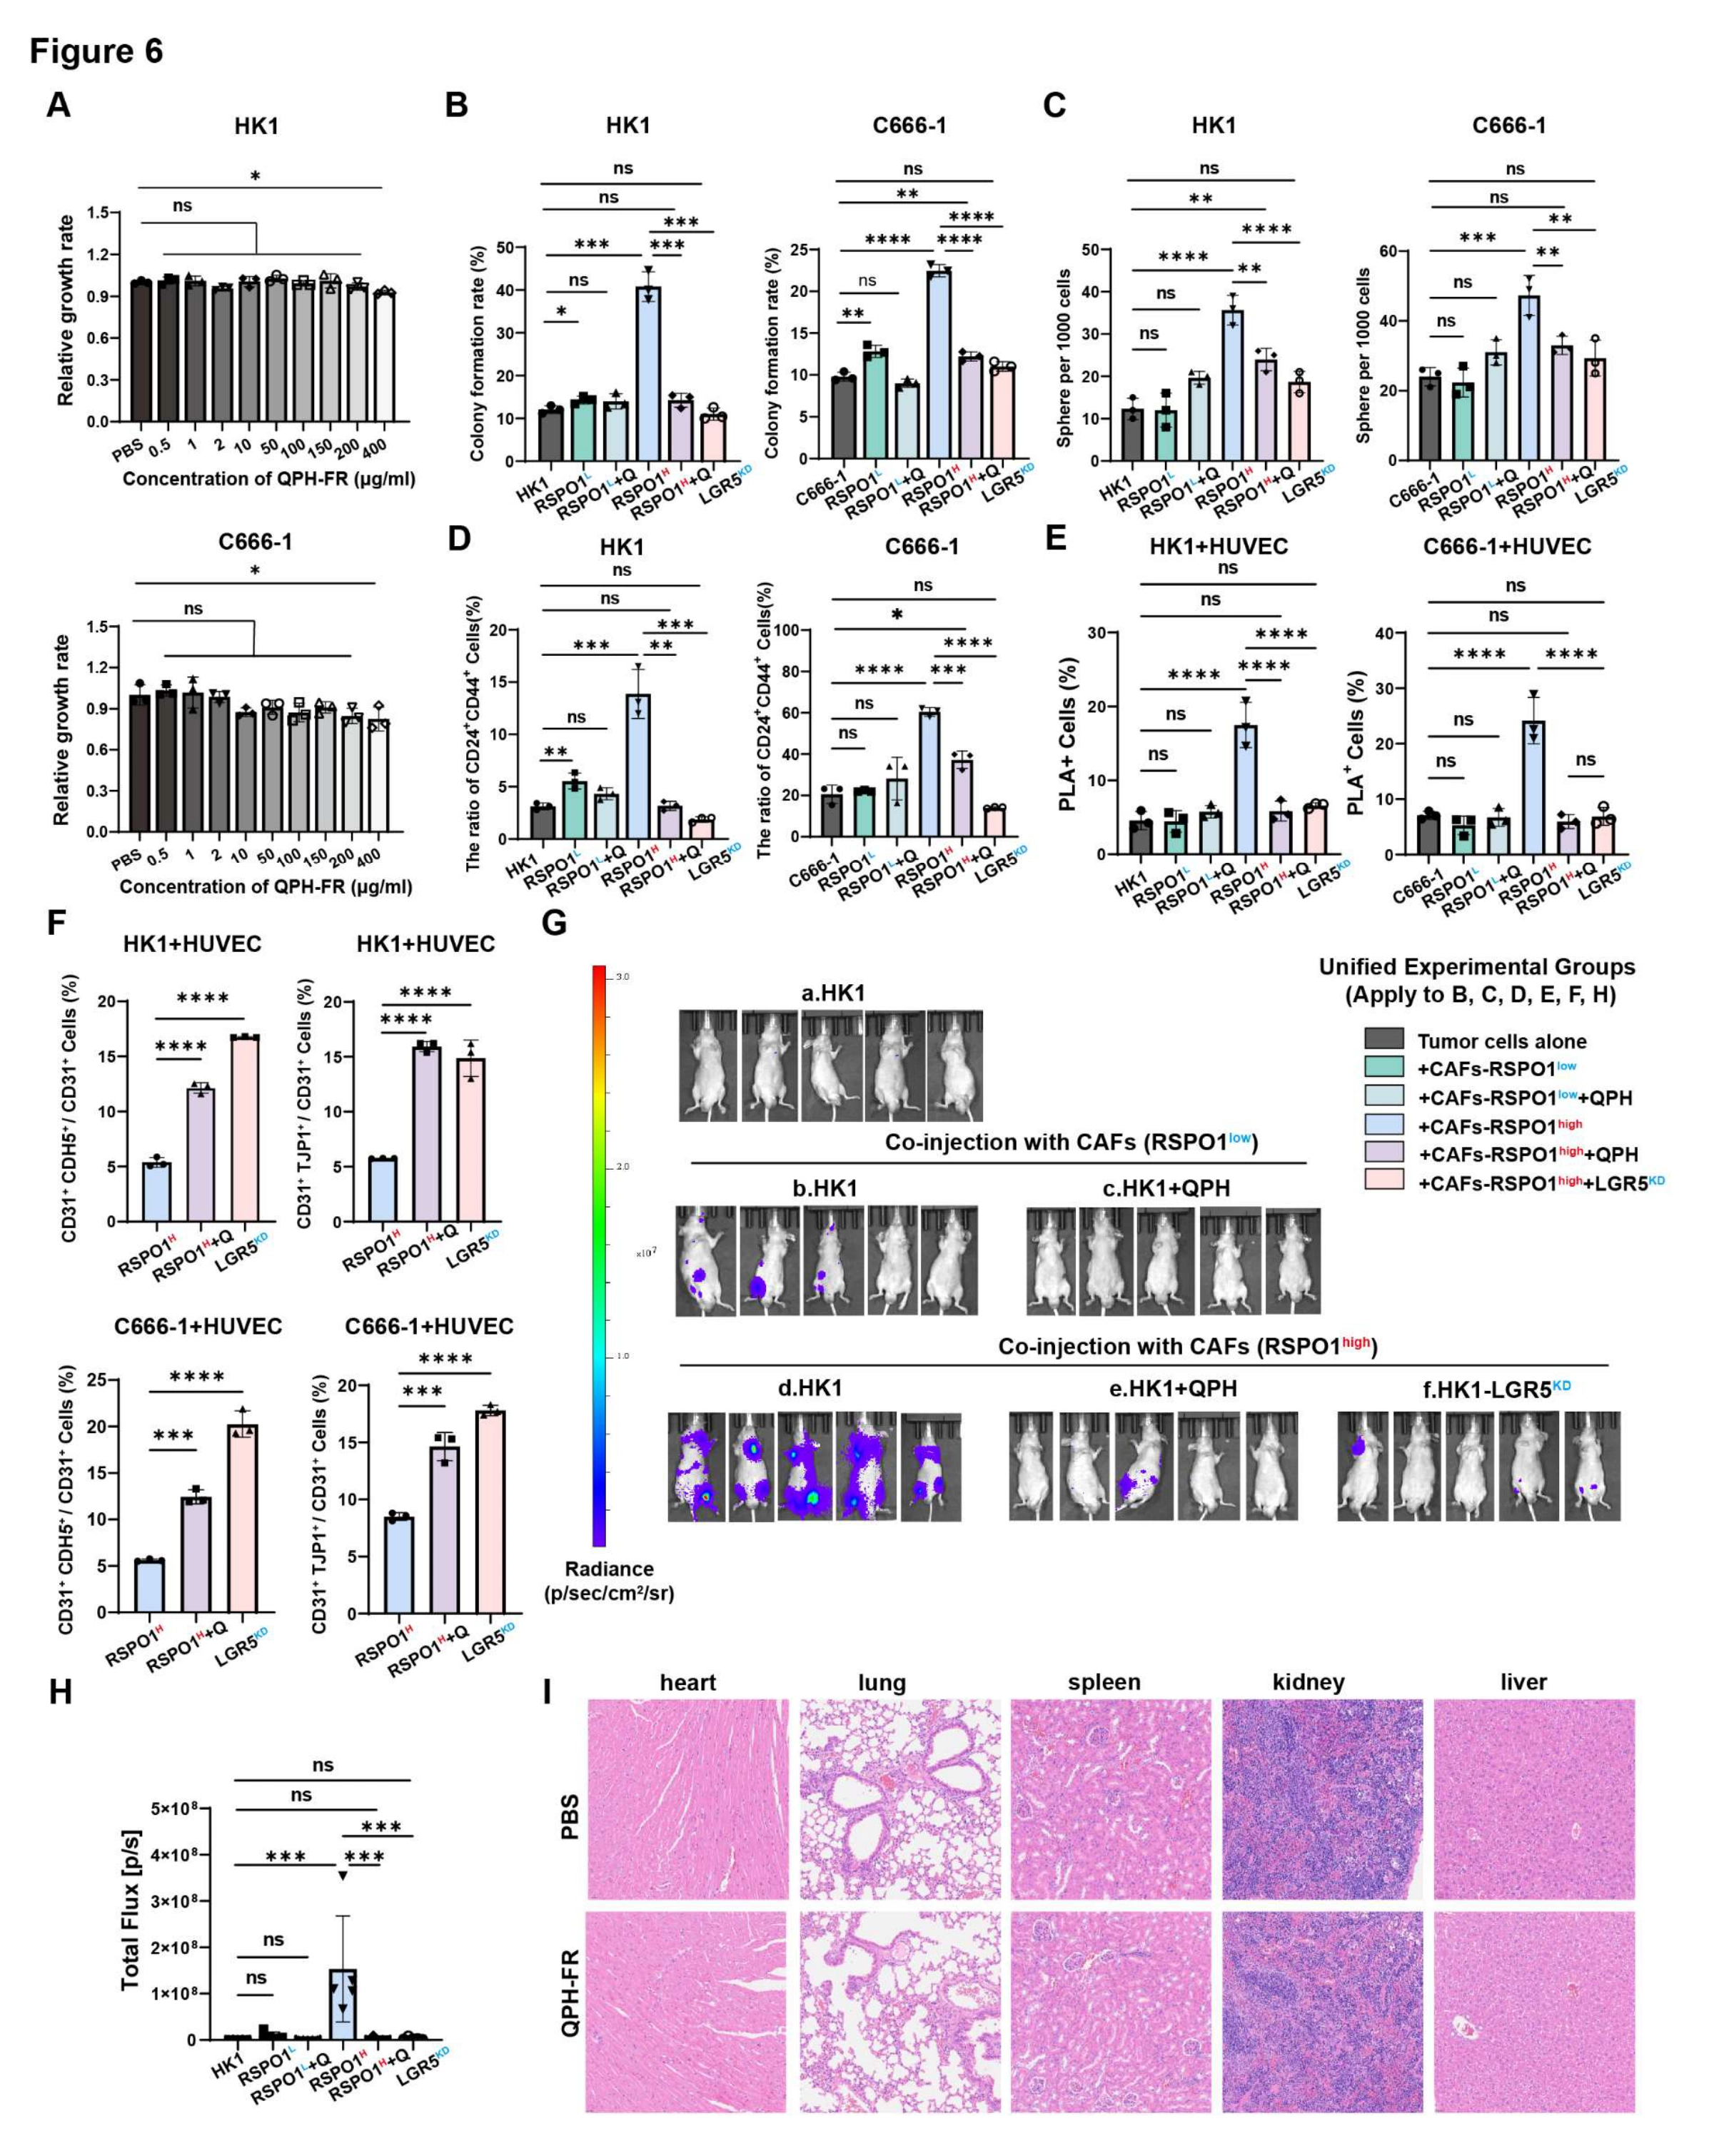
QPH-FR blocks the RSPO1–LGR5 axis and suppresses metastatic dissemination with minimal toxicity
The final figure turns the mechanism into an intervention question: does blocking the RSPO1–LGR5 axis alter stem-like features, endothelial contact and dissemination? A establishes the viability context, B–F examine mechanistic phenotypes, G–H test dissemination in vivo, and I inspects major-organ histology.
AEstablish the viability context
CCK-8 viability assays in HK1 and C666-1 cells treated with QPH-FR (0.5–400 μg/mL) for 48 h. The concentration–viability relationship provides context for interpreting subsequent reductions in functional readouts.
B, CTest colony and sphere formation
Colony formation (B) and tumor sphere formation (C) after the indicated CAF- conditioning, QPH-FR, and LGR5-depletion conditions. Comparing CAF levels, treatment and receptor depletion tests how intervention affects CAF-associated tumor phenotypes.
DMeasure the stem-like marker population
Flow cytometric analysis of CD24+ CD44+ cancer stem-like cells under indicated co-culture conditions. Marker proportions complement B–C without being treated as a complete measure of stem-cell function.
ETest intervention at the contact step
PLA-signals quantification in direct tumor–endothelial co-cultures after tumor- cell preconditioning. This revisits the PTPRM-linked contact step, connecting the intervention to the preceding mechanism.
FExamine the downstream junction response
Flow cytometry analysis of endothelial junctional markers (CDH5+CD31+ and TJP1+CD31+) following direct co-culture with pre-conditioned tumor cells. The junction markers connect contact signaling to endothelial state rather than assessing treatment solely in tumor cells.
G, HTest dissemination in vivo
In vivo bioluminescent imaging (G) and quantification of total photon flux (H) from the intracardiac metastasis model. Mice were injected with HK1 cells alone (5 × 10⁵) or co-injected with patient-derived RSPO1low or RSPO1high CAFs (5 × 10⁴) treated with PBS or QPH-FR. QPH-FR (10 mg/kg, i.p., twice weekly) was administered starting day 7; n=5 per group. G shows imaging and H group quantification; intracardiac injection tests post-injection dissemination, not the entire spontaneous metastatic cascade.
IInspect major-organ morphology
Representative H&E staining of heart, lung, spleen, kidney, and liver after PBS or QPH-FR treatment. Scale bars, 25 μm. Experimental conditions for (B–F and H): 1, tumor-cell monoculture; 2, indirect co-culture with RSPO1-low CAFs; 3, indirect co-culture with RSPO1-low CAFs plus QPH-FR (100 μg/mL); 4, indirect co-culture with RSPO1-high CAFs; 5, indirect co-culture with RSPO1-high CAFs plus QPH-FR (100 μg/mL); 6, indirect co-culture of LGR5-depleted tumor cells with RSPO1-high CAFs. For endothelial assays, tumor cells were preconditioned for 48 h and then directly co- cultured with HUVECs. Data are the mean ± SD. P values were calculated using one- way ANOVA. ns, not significant; *P < 0.05, **P < 0.01, ***P < 0.001, and ****P < 0.0001. This adds a tolerability observation; preserved morphology does not rule out all potential toxicity.
Takeaway
QPH-FR treatment and LGR5 depletion are examined in a shared framework linking cell state, vascular junctions and in vivo dissemination. These are preclinical results in the tested models; organ H&E does not substitute for a complete toxicology or clinical safety assessment.
My contribution
I am a coauthor of this manuscript.
Outcomes & record
Submitted to Cancer Research and currently under review.