Biomed / 07
Fibrotic reprogramming in ovarian cancer
Combines single-cell omics, functional experiments and clinical cohorts to study fibroblast-like tumor states and PLAT–TWIST1–SEMA3C–NRP2 signaling in high-grade serous ovarian cancer. I contributed experimental and manuscript work as a coauthor. The manuscript is under review.
- Publication status
- Under review
- Submitted to
- Science Advances
Abstract
High-grade serous ovarian cancer (HGSOC) is the most lethal gynecologic malignancy worldwide and poses a serious threat to women’s health. Owing to its pronounced heterogeneity and cellular plasticity, curative therapeutic strategies remain unavailable. Using single-cell multi-omic profiling, we performed integrated computational and functional analyses to delineate the molecular mechanisms underlying HGSOC progression.
Molecular classification revealed three distinct subtypes: C1, C2, and C3, with the C3 exhibiting the poorest prognosis. Notably, C3 tumor cells displayed cancer-associated fibroblast (CAF)-like molecular signatures and harbored oncogenic mutation profiles. This fibroblast-like conversion was characterized by marked activation of the PLAT/PLAU-mediated fibrinolytic pathway.
Through PLAT overexpression and knockdown experiments in cell lines and mouse models, we demonstrated that PLAT is a key driver of fibroblast-like reprogramming, CAF recruitment, and tumorigenic potential. Secretome analyses further suggested that fibrotic ovarian cancer cells recruit fibroblasts via a Twist1-regulated SEMA3C–NRP2 axis, and silencing SEMA3C markedly impaired fibroblast recruitment. Moreover, inhibition of plasmin activity enhanced the chemosensitivity of fibrotic ovarian cancer cells, highlighting a potential therapeutic opportunity for treating the most lethal C3-type of HGSOC.
Figures
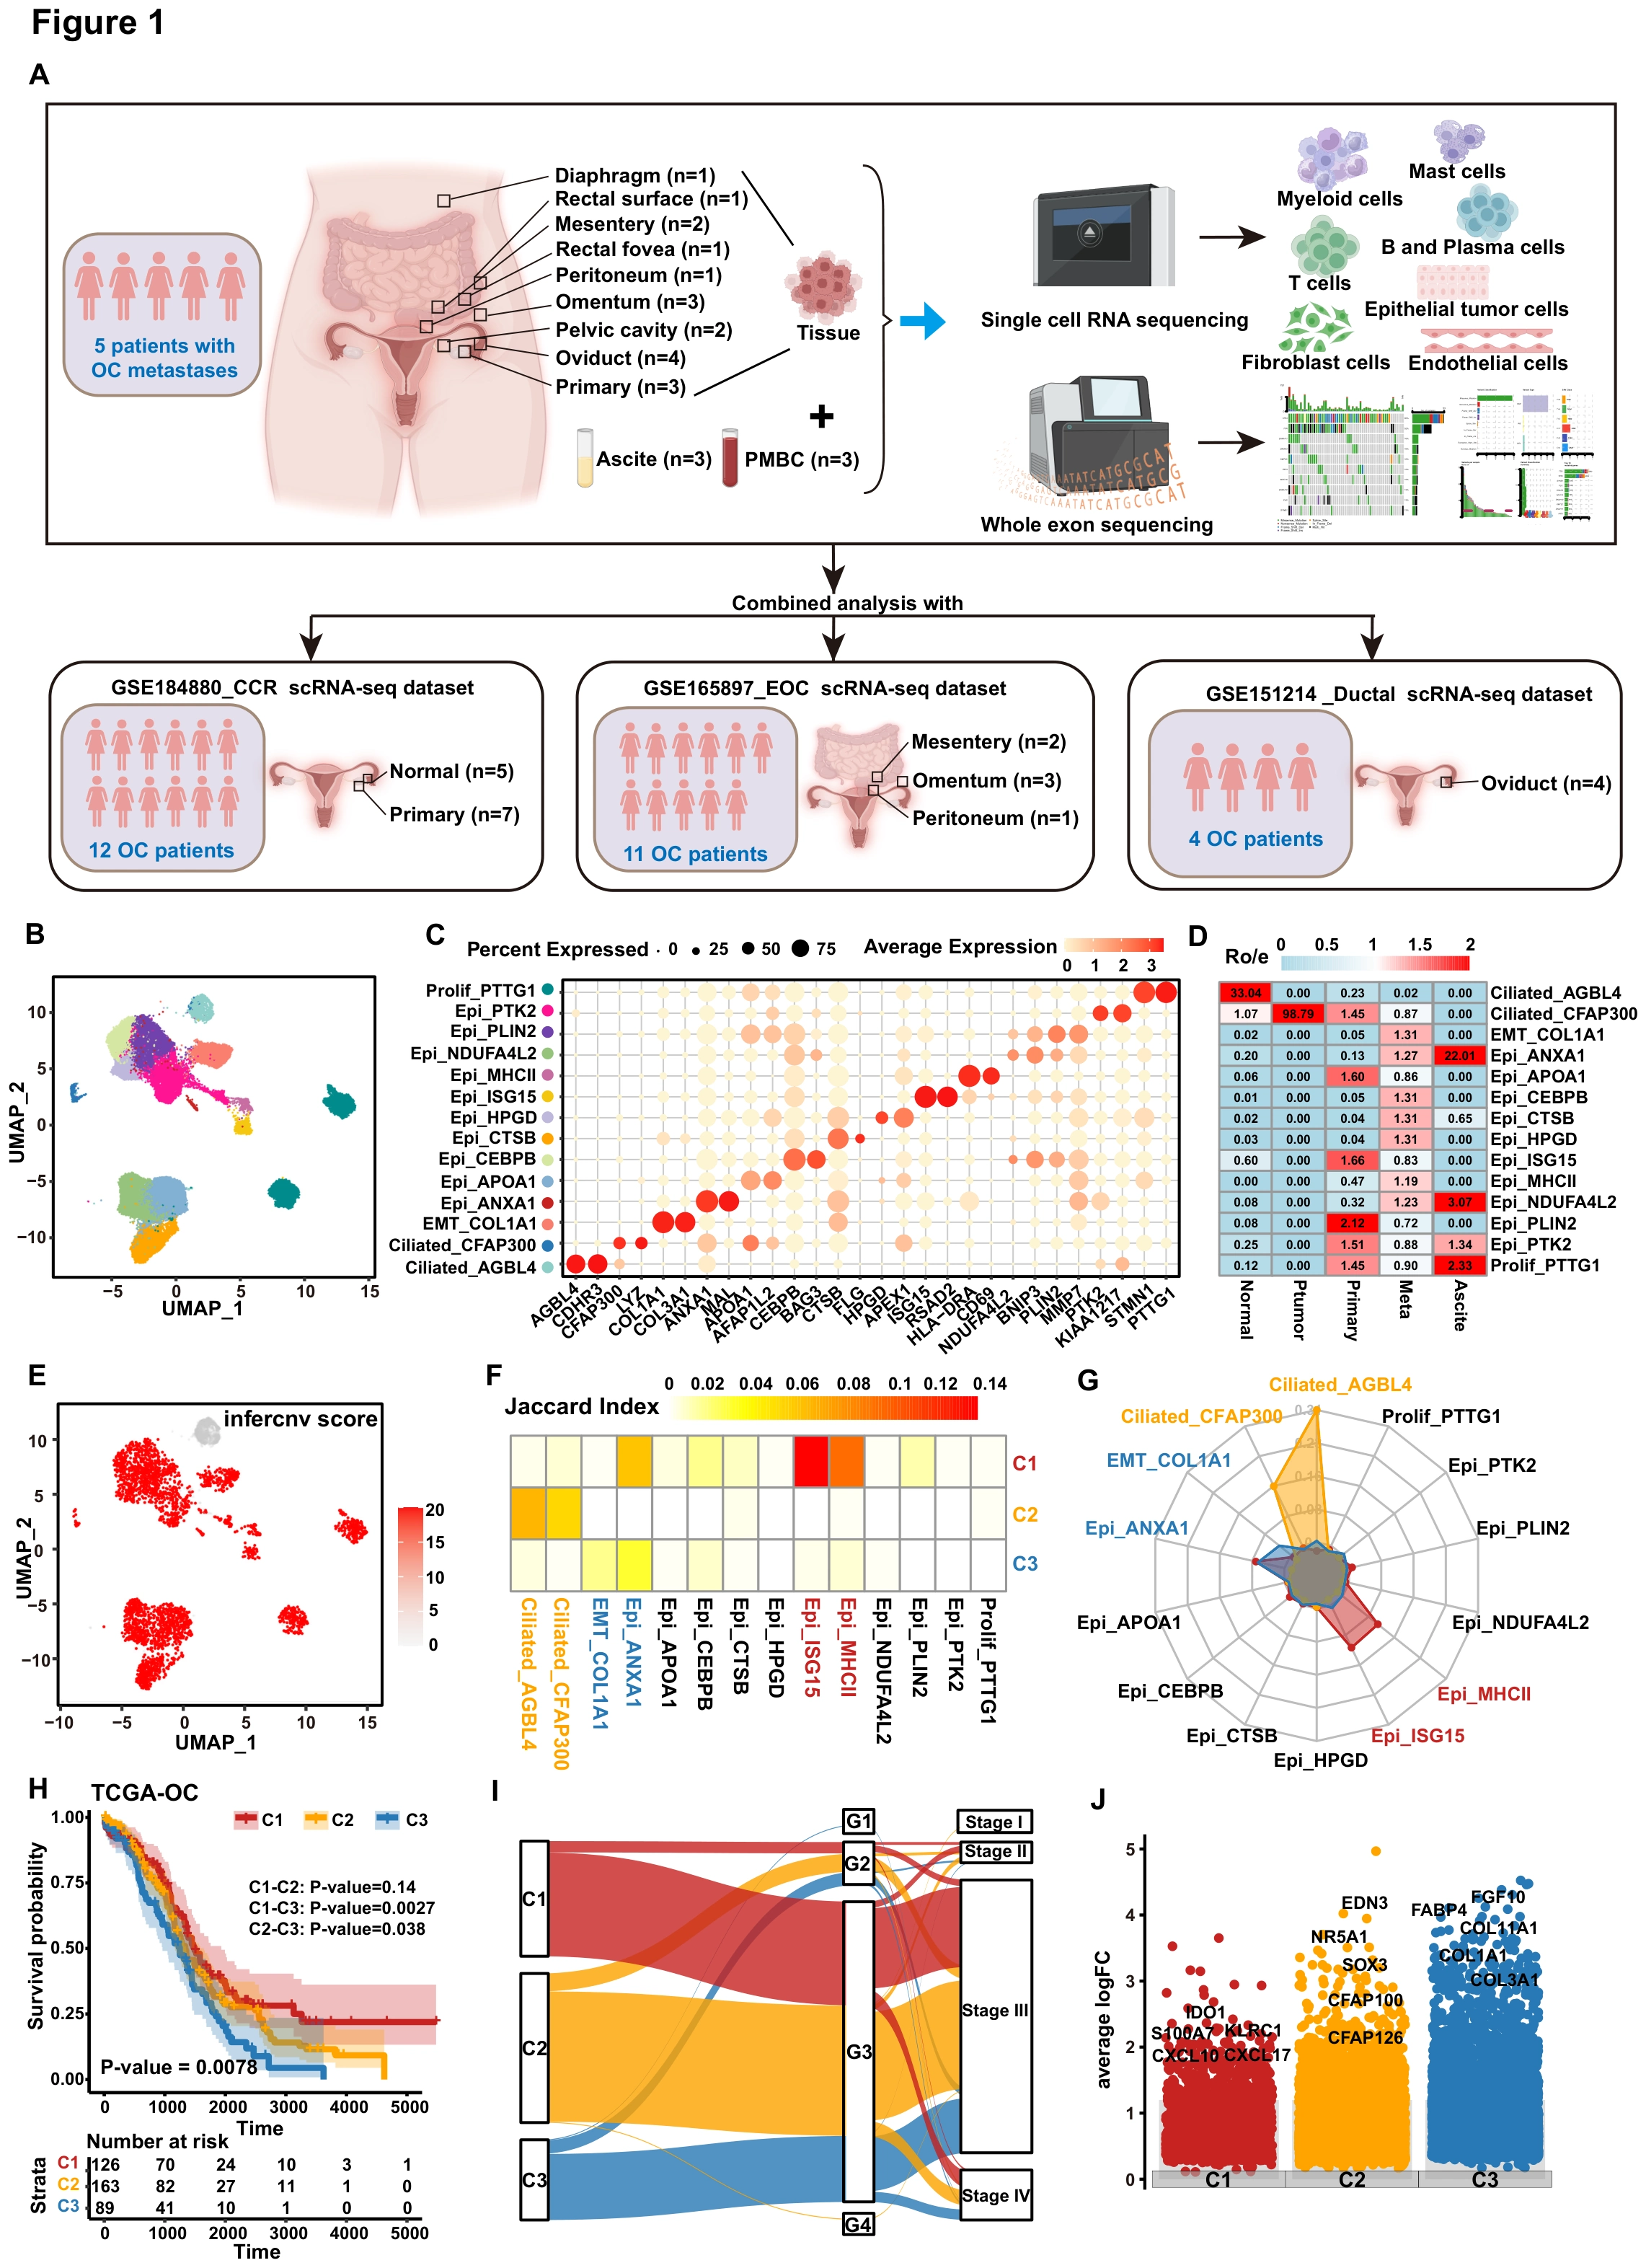
Ovarian cancer patients are divided into three subtypes and C3 type patients have the worst prognosis
The study first asks whether HGSOC contains molecular subtypes with different outcomes. A–E define epithelial states and malignancy context, F–G relate them to C1–C3 in TCGA-OV, and H–J compare survival, clinical characteristics and expression programs.
ADefine the sampling and integration framework
The overall research design flowchart of sample collection and sequencing analysis of OC patients. We recruited 5 patients with high-grade serous ovarian cancer to participate in this study. A total of 24 samples were analyzed, including n=3 PBMC samples, n=3 Pri. OT samples, n=3 normal tissues, n=12 Meta samples, and n=3 ascites samples. Distinguishing sample sources underpins the interpretation of cell populations and patient subtypes.
BMap epithelial cell states
The UMAP plot of the epithelial cell subpopulations are integrated in all patients. Each dot indicated a single cell. Color-coded for the cell type. Patient subtypes will be linked to these cellular states rather than remaining only bulk-level categories.
CCheck population markers
The dot plot showing the particular genes for each subcluster of epithelial cells. Markers provide interpretable molecular identities for the clusters in B.
DCompare tissue preferences
Tissue prevalence estimated by Ro/e score in epithelial cells. This examines the tissue contexts preferentially represented by each state.
EAdd malignant-identity evidence
The UMAP plot shows the CNV score of each epithelial cell subpopulation. Copy-number scores add malignancy context to the comparison of cell states.
FLink patient subtypes to cell-state signatures
Jaccard index analysis of specific expression genes of each subtype (C1, C2, and C3) patients from TCGA-OV cohort in various epithelial subclusters. Gene-set overlap supplies an initial connection between C1–C3 and the single-cell populations.
GCross-check the subtype correspondence
MCP_counter algorithm analysis of specific gene expression of each subtype (C1, C2, and C3) patients from TCGA-OV cohort in various epithelial subclusters. This complements F by examining the cell-state correspondence through another computational readout.
HExamine outcome differences between subtypes
Overall survival analysis among C1-C3 subtypes patients in TCGA-OV cohort. The survival comparison explains why C3 becomes the subsequent focus rather than an arbitrarily selected cluster.
IRelate the subtypes to clinical categories
Sankey chart displaying the path analysis in TCGA-OV patients among the C1-C3 subtypes, grading of TCGA-OV, and staging of TCGA-OV. The line indicates the group; the width of the lines signifies the number of patients who shifted from one state to another. This compares subtype and clinical-category correspondence rather than longitudinal stage changes in individual patients.
JIdentify the molecular themes of each subtype
The dot plot shows the representative upregulated genes in each subtype (C1, C2, and C3) based on DEG analysis in TCGA-OV cohort. Differential genes connect outcome differences to immune, ciliary or fibrotic programs requiring further investigation.
Takeaway
The figure identifies a problem requiring explanation: the poorer outcome of C3 and its associated molecular features. Figure 2 examines the fibroblast-like program in greater detail, asking which cellular states contribute and how PLAT relates to them.
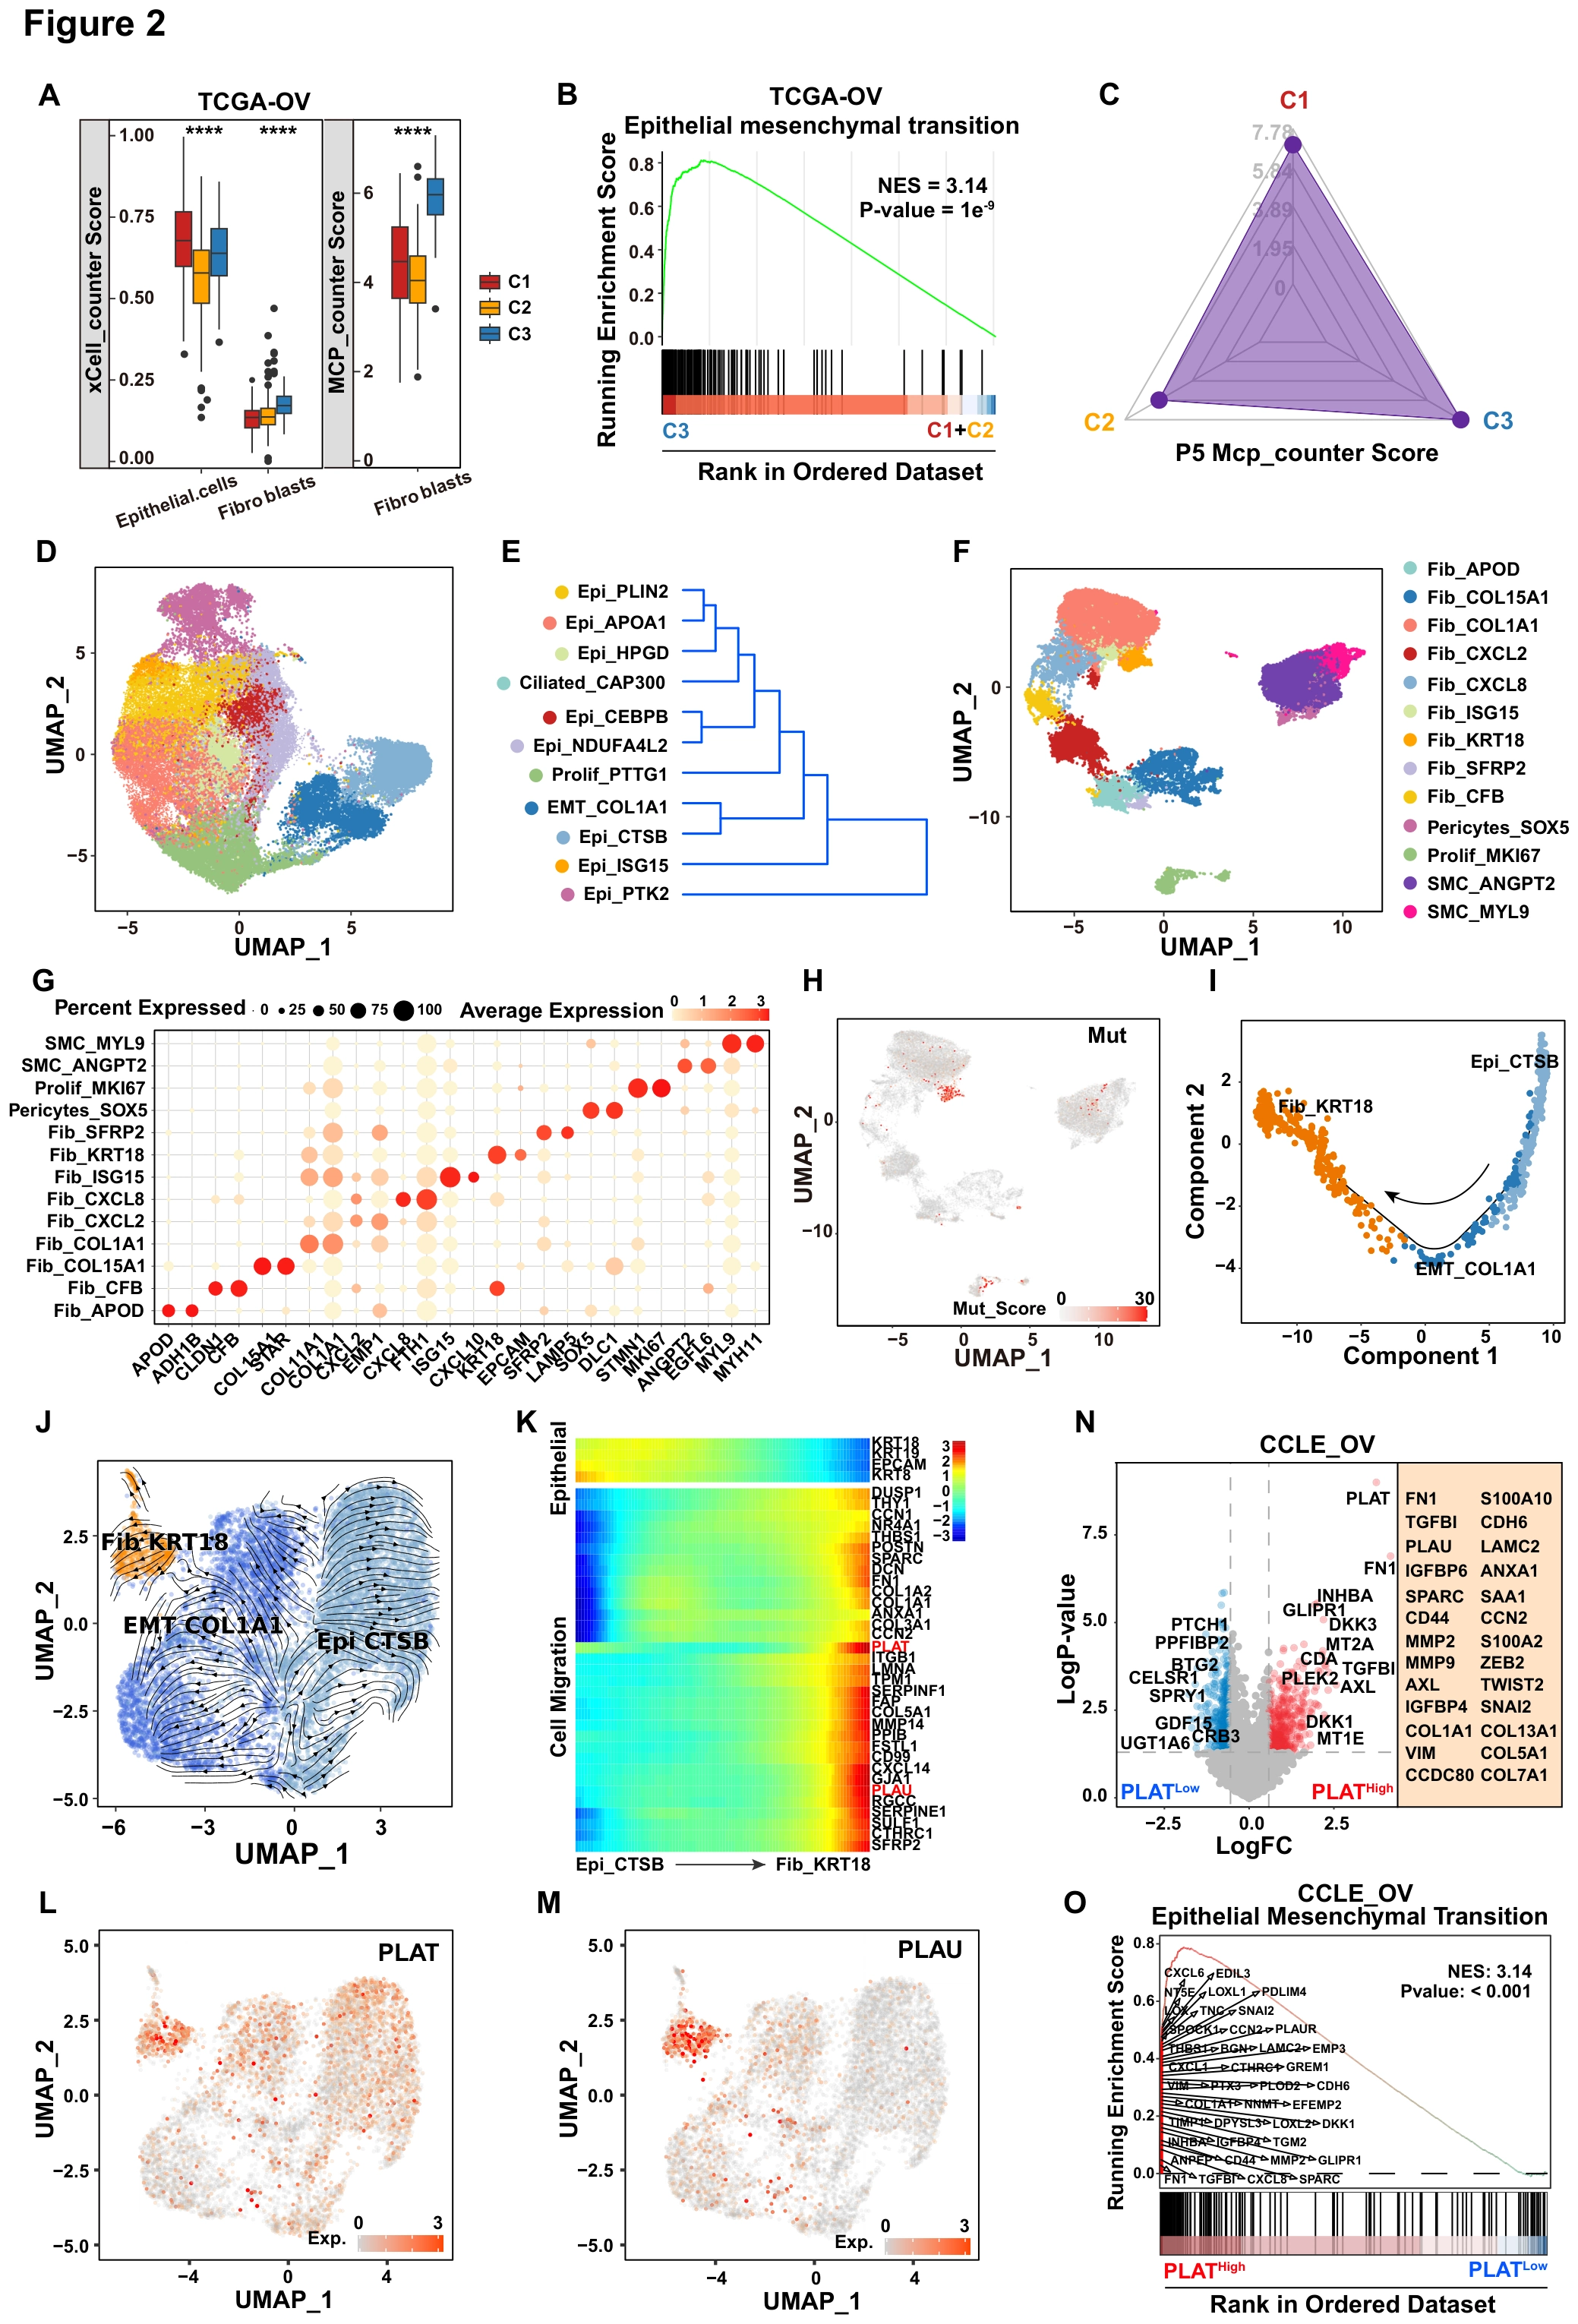
The transformation of tumor cells to fibroblasts in C3 subtype patients may be related to the increased expression of PLAT gene
After identifying the poorer-outcome C3 subtype, this figure investigates its fibroblast-like features. A–H compare patient subtype and epithelial/fibroblast states, I–M use inferred trajectories and expression to nominate PLAT/PLAU, and N–O examine the association between PLAT level and EMT programs.
ACompare composition-associated signals across subtypes
The bar plot shows the epithelial cells and fibroblast cells infiltration score in C1, C2, and C3 subtypes patients from TCGA-OV cohort. The infiltration scores were calculated using xCell (left) or MCP_counter (right). Statistical significance was assessed by two-tailed Student’s t-test. ****, P < 0.0001. Two methods examine the composition question and contextualize the fibroblast-associated C3 signal.
BInspect the C3 EMT program
The enrichment of the Epithelial mesenchymal transition pathway in the C3 subtype patients of TCGA-OV cohort. This links the patient subtype to a candidate explanation involving epithelial-state changes.
CPlace the focal patient within the subtype framework
The radar plot shows the MCP_counter score of C1, C2, and C3 subtypes in P5 patient. This locates the case selected for more detailed analysis within the overall subtype framework.
DResolve within-patient epithelial heterogeneity
The UMAP plot of the epithelial cell subpopulations are integrated in P5 patient. Each dot indicated a single cell. Color-coded for the cell type. This supplies a within-patient atlas for the subsequent state comparisons.
EInspect similarities between epithelial states
The dendrogram shows the similarities among the epithelial cell subpopulations. The hierarchy identifies similarities without directly establishing one state converting into another.
FMap the fibroblast states
The UMAP plot of the fibroblast cell subpopulations are integrated in OV patient. Each dot indicated a single cell. Color-coded for the cell type. Both epithelial and fibroblast states must be defined before examining links between them.
GCheck fibroblast-population markers
Dot plot shows the marker genes for each subpopulation of fibroblast cells in OV. Marker expression explains the molecular features of the populations in F.
HInspect mutation-associated context
The UMAP plot displays the mutation score in the fibroblast cells. The score adds a tumor-associated dimension beyond state-marker expression.
IFormulate a cross-state trajectory hypothesis
Analysis of simulated differentiation trajectories of two epithelial cell subclusters (Epi_CTSB and EMT_ COL1A1) and one fibroblast subcluster (Fib_KRT18) in OV. Each dot corresponds to a cell, and each colour represents a cell subcluster. The inferred trajectory places the three candidates in one framework that still requires experimental mechanistic testing.
JCompare inferred transition direction
The RNA velocity analysis graph reflected the evolutionary relationship among the three cell subclusters in I. RNA velocity complements I with another inferred relationship rather than direct lineage tracing.
KInspect program changes along the trajectory
The heatmap shows the expression of genes involved in cell migration and Epithelial pathway during the process of cell transformation. Expression changes give molecular meaning to the inferred path through migration and epithelial programs.
LLocate PLAT along the candidate states
The UMAP plot shows the expression of PLAT in the Epi_CTSB, EMT_ COL1A1, and Fib_KRT18 subclusters of P5 patient. This places the molecule selected for perturbation within the previously defined state relationships.
MInspect PLAU alongside PLAT
The UMAP plot shows the expression of PLAU in the Epi_CTSB, EMT_ COL1A1, and Fib_KRT18 subclusters of P5 patient. Read with L, this examines two fibrinolysis-related candidates without treating them as the same gene.
NCompare expression programs by PLAT level
The volcano map showing differentially expressed genes between the high- and low-level PLAT expression groups (high: logFC > 0.3 and log p-value >2; low: logFC < −0.3 and log p-value >2) in OV cell lines. The EMT pathway-related genes were enriched in the high group. The cell-line comparison adds an association distinct from the patient-subtype analysis.
OSummarize the PLAT-associated EMT signal
The enrichment of the Epithelial mesenchymal transition pathway in the high-level PLAT expression group of OV cell lines. Together with the gene-level results in N, this motivates the functional perturbations in Figure 3.
Takeaway
The results connect the fibrotic C3 signal with particular states, PLAT/PLAU and EMT, while inferred trajectories and expression associations are not direct cell-fate proof. Figure 3 therefore turns to overexpression and depletion to test effects on cell behavior.
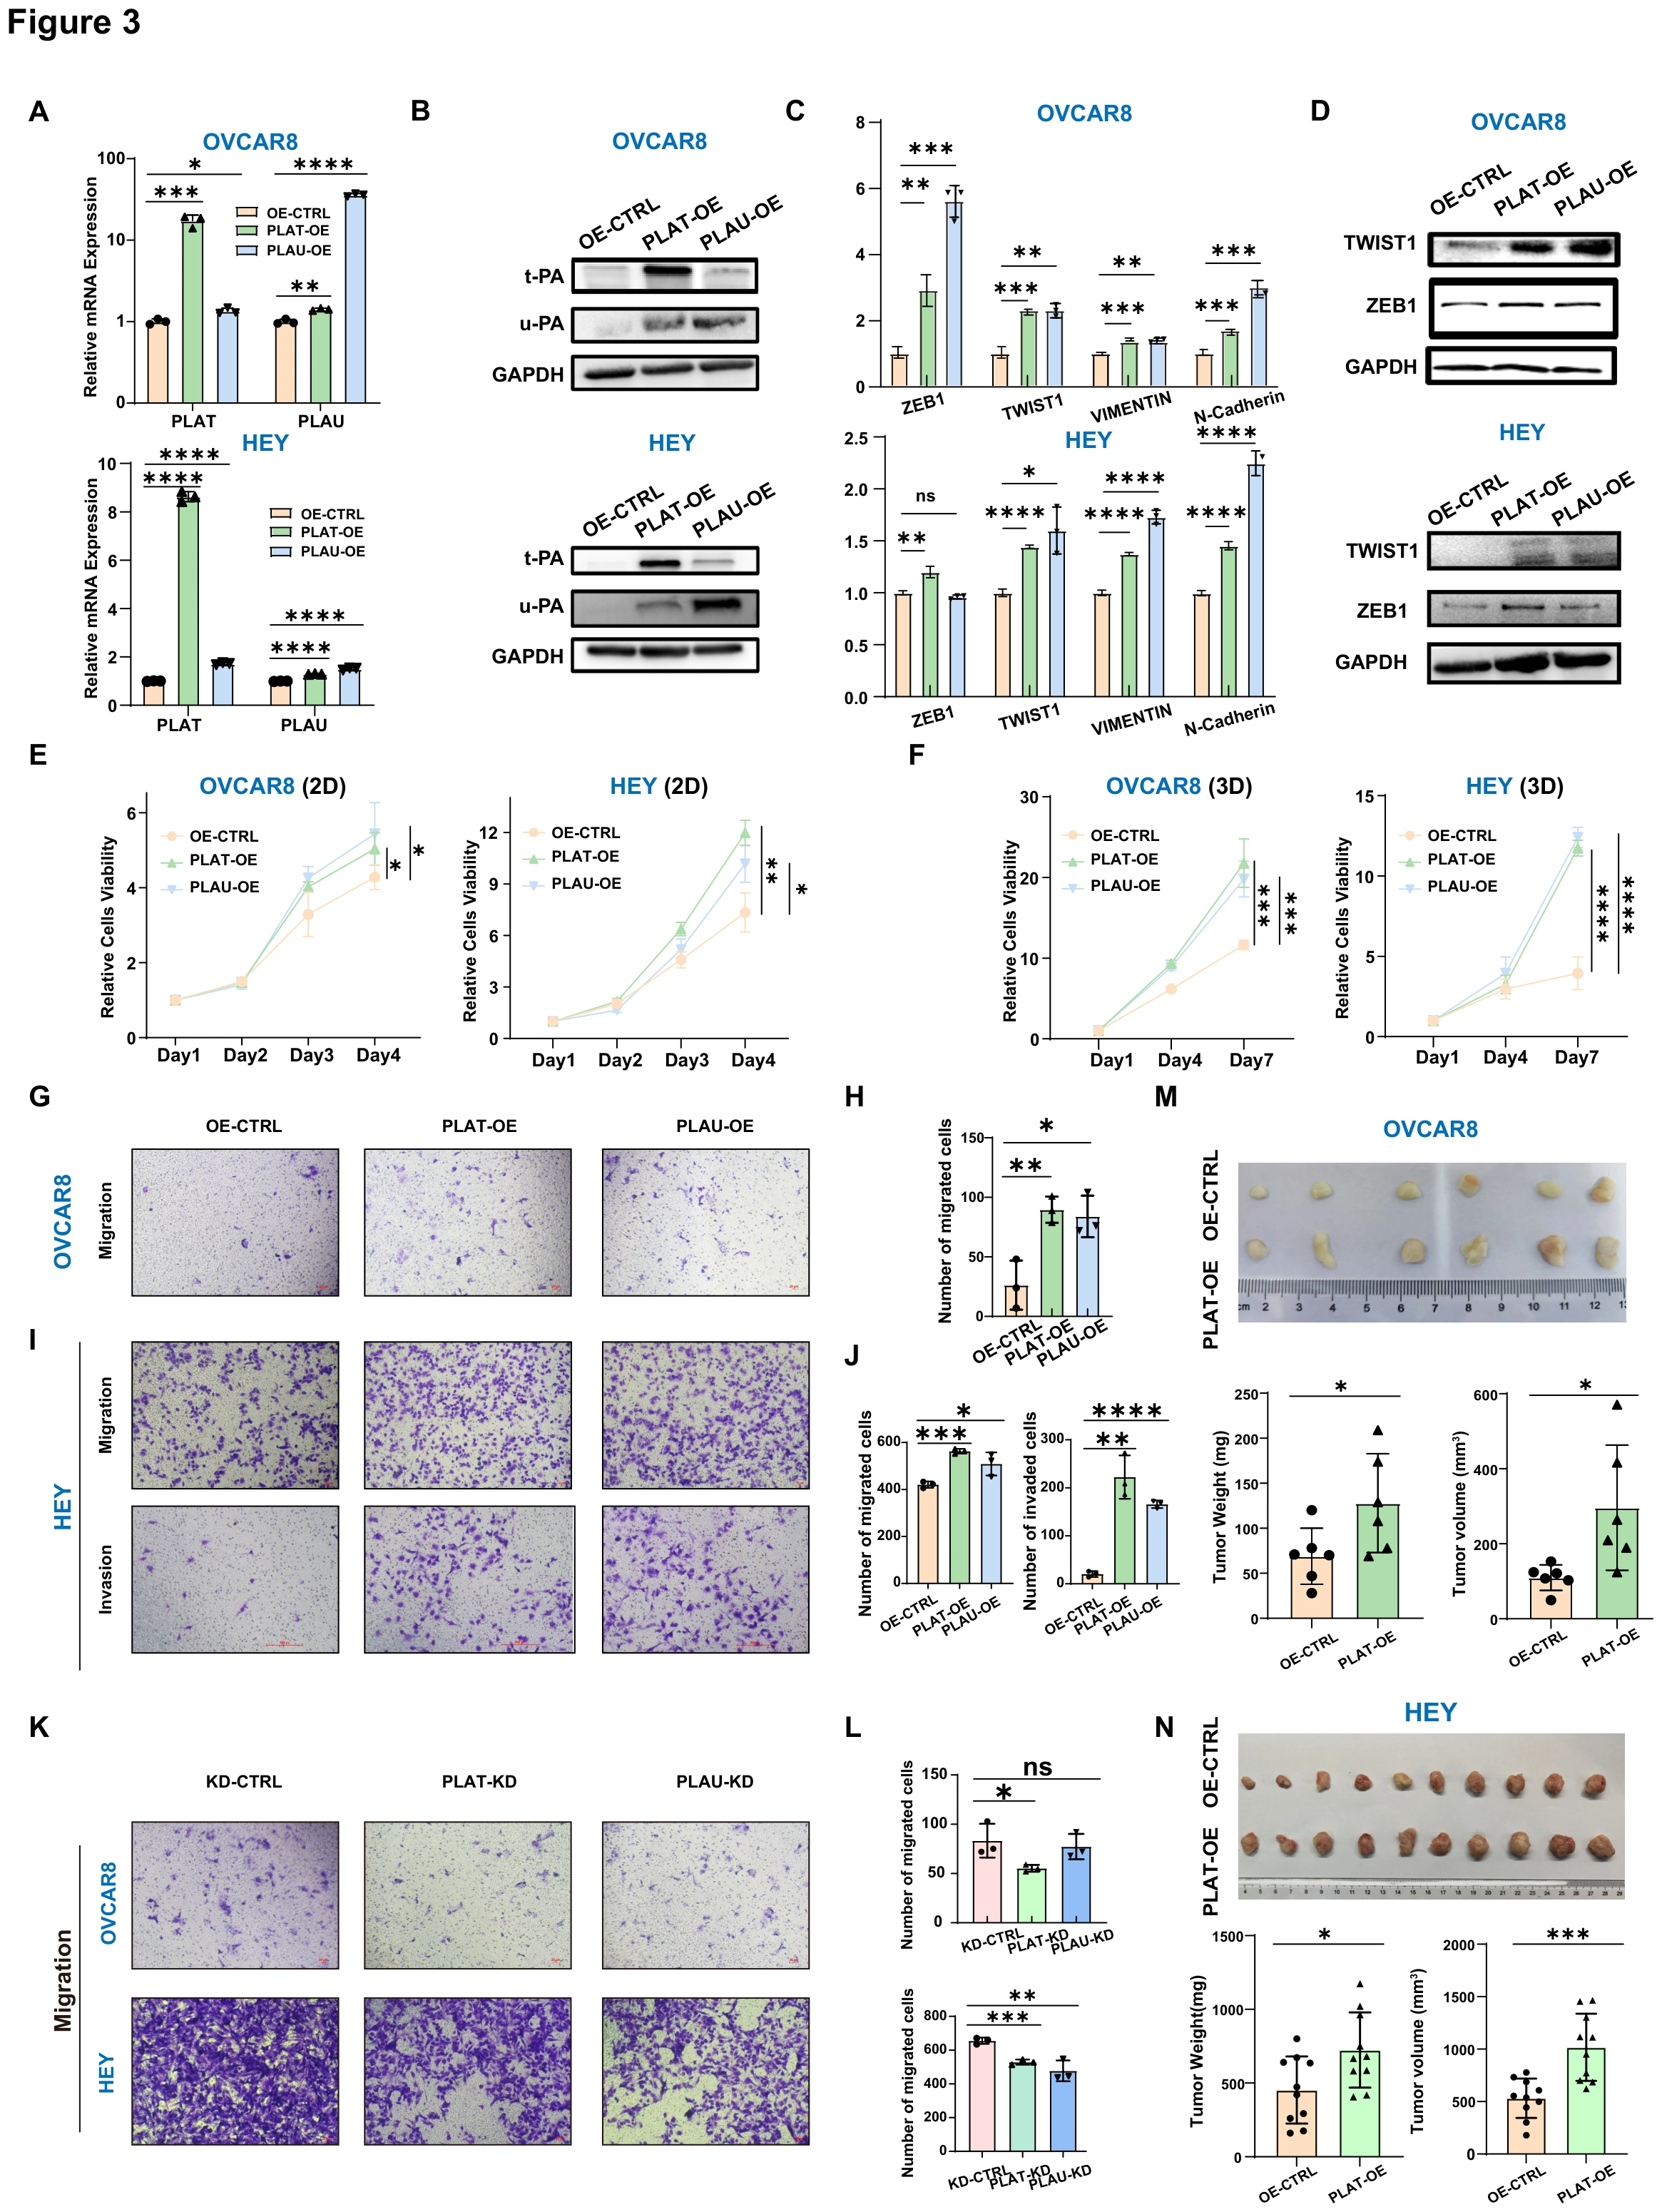
t-PA/u-PA Mediated Activation of the Fibrinolytic System Promotes Malignant Transformation of Ovarian Cancer Cells
The preceding association is now tested by perturbation. A–D validate PLAT/PLAU overexpression and EMT-related responses, E–J examine growth, migration and invasion, K–L add depletion as a reverse test, and M–N extend the analysis to tumors in vivo.
A–BValidate the experimental perturbation
Representative qPCR and Western blot validation of t-PA and u-PA overexpression in ovarian cancer cell lines OVCAR8 and HEY. RNA and protein measurements establish the perturbation before the functional comparisons.
C–DExamine EMT-associated molecular responses
Expression levels of EMT-related genes following t-PA or u-PA overexpression. This tests whether the program associated in Figure 2 responds to active perturbation.
E–FCompare growth in 2D and 3D culture
Cell viability curves of ovarian cancer cell lines under 2D and 3D culture conditions after gene overexpression. The two environments test whether the response is confined to one culture setting.
G-HMeasure migration in OVCAR8
Migration assays and quantification in OVCAR8 overexpression cells. Images and quantification connect molecular changes to migratory behavior.
I-JExtend testing to migration and invasion in HEY
Migration and invasion assays with quantification in HEY overexpression cells. A second cell line and an invasion readout broaden the functional comparison.
K-LUse depletion as the reverse test
Migration assays and quantification in OVCAR8 and HEY cells after t-PA and u-PA knockdown. Paired with overexpression, depletion tests whether reducing the candidate factors also alters the behavior.
M-NExtend the test to in vivo tumors
Representative images of subcutaneous xenografts derived from OVCAR8 and HEY cells, together with tumor weight and volume analyses. P ≤ 0.05 was considered statistically significant and was represented with * for P ≤ 0.05, ** for P ≤ 0.01, *** for P ≤ 0.001, and **** for P ≤ 0.0001, and ns for unsignificant. Weight, volume and representative tumors test whether culture-based findings extend to mice.
Takeaway
Construct validation and perturbations in opposite directions go beyond describing the features of high-expressing cells. Figure 4 next expands the focus from tumor-cell behavior to interactions with fibroblasts and the surrounding matrix.
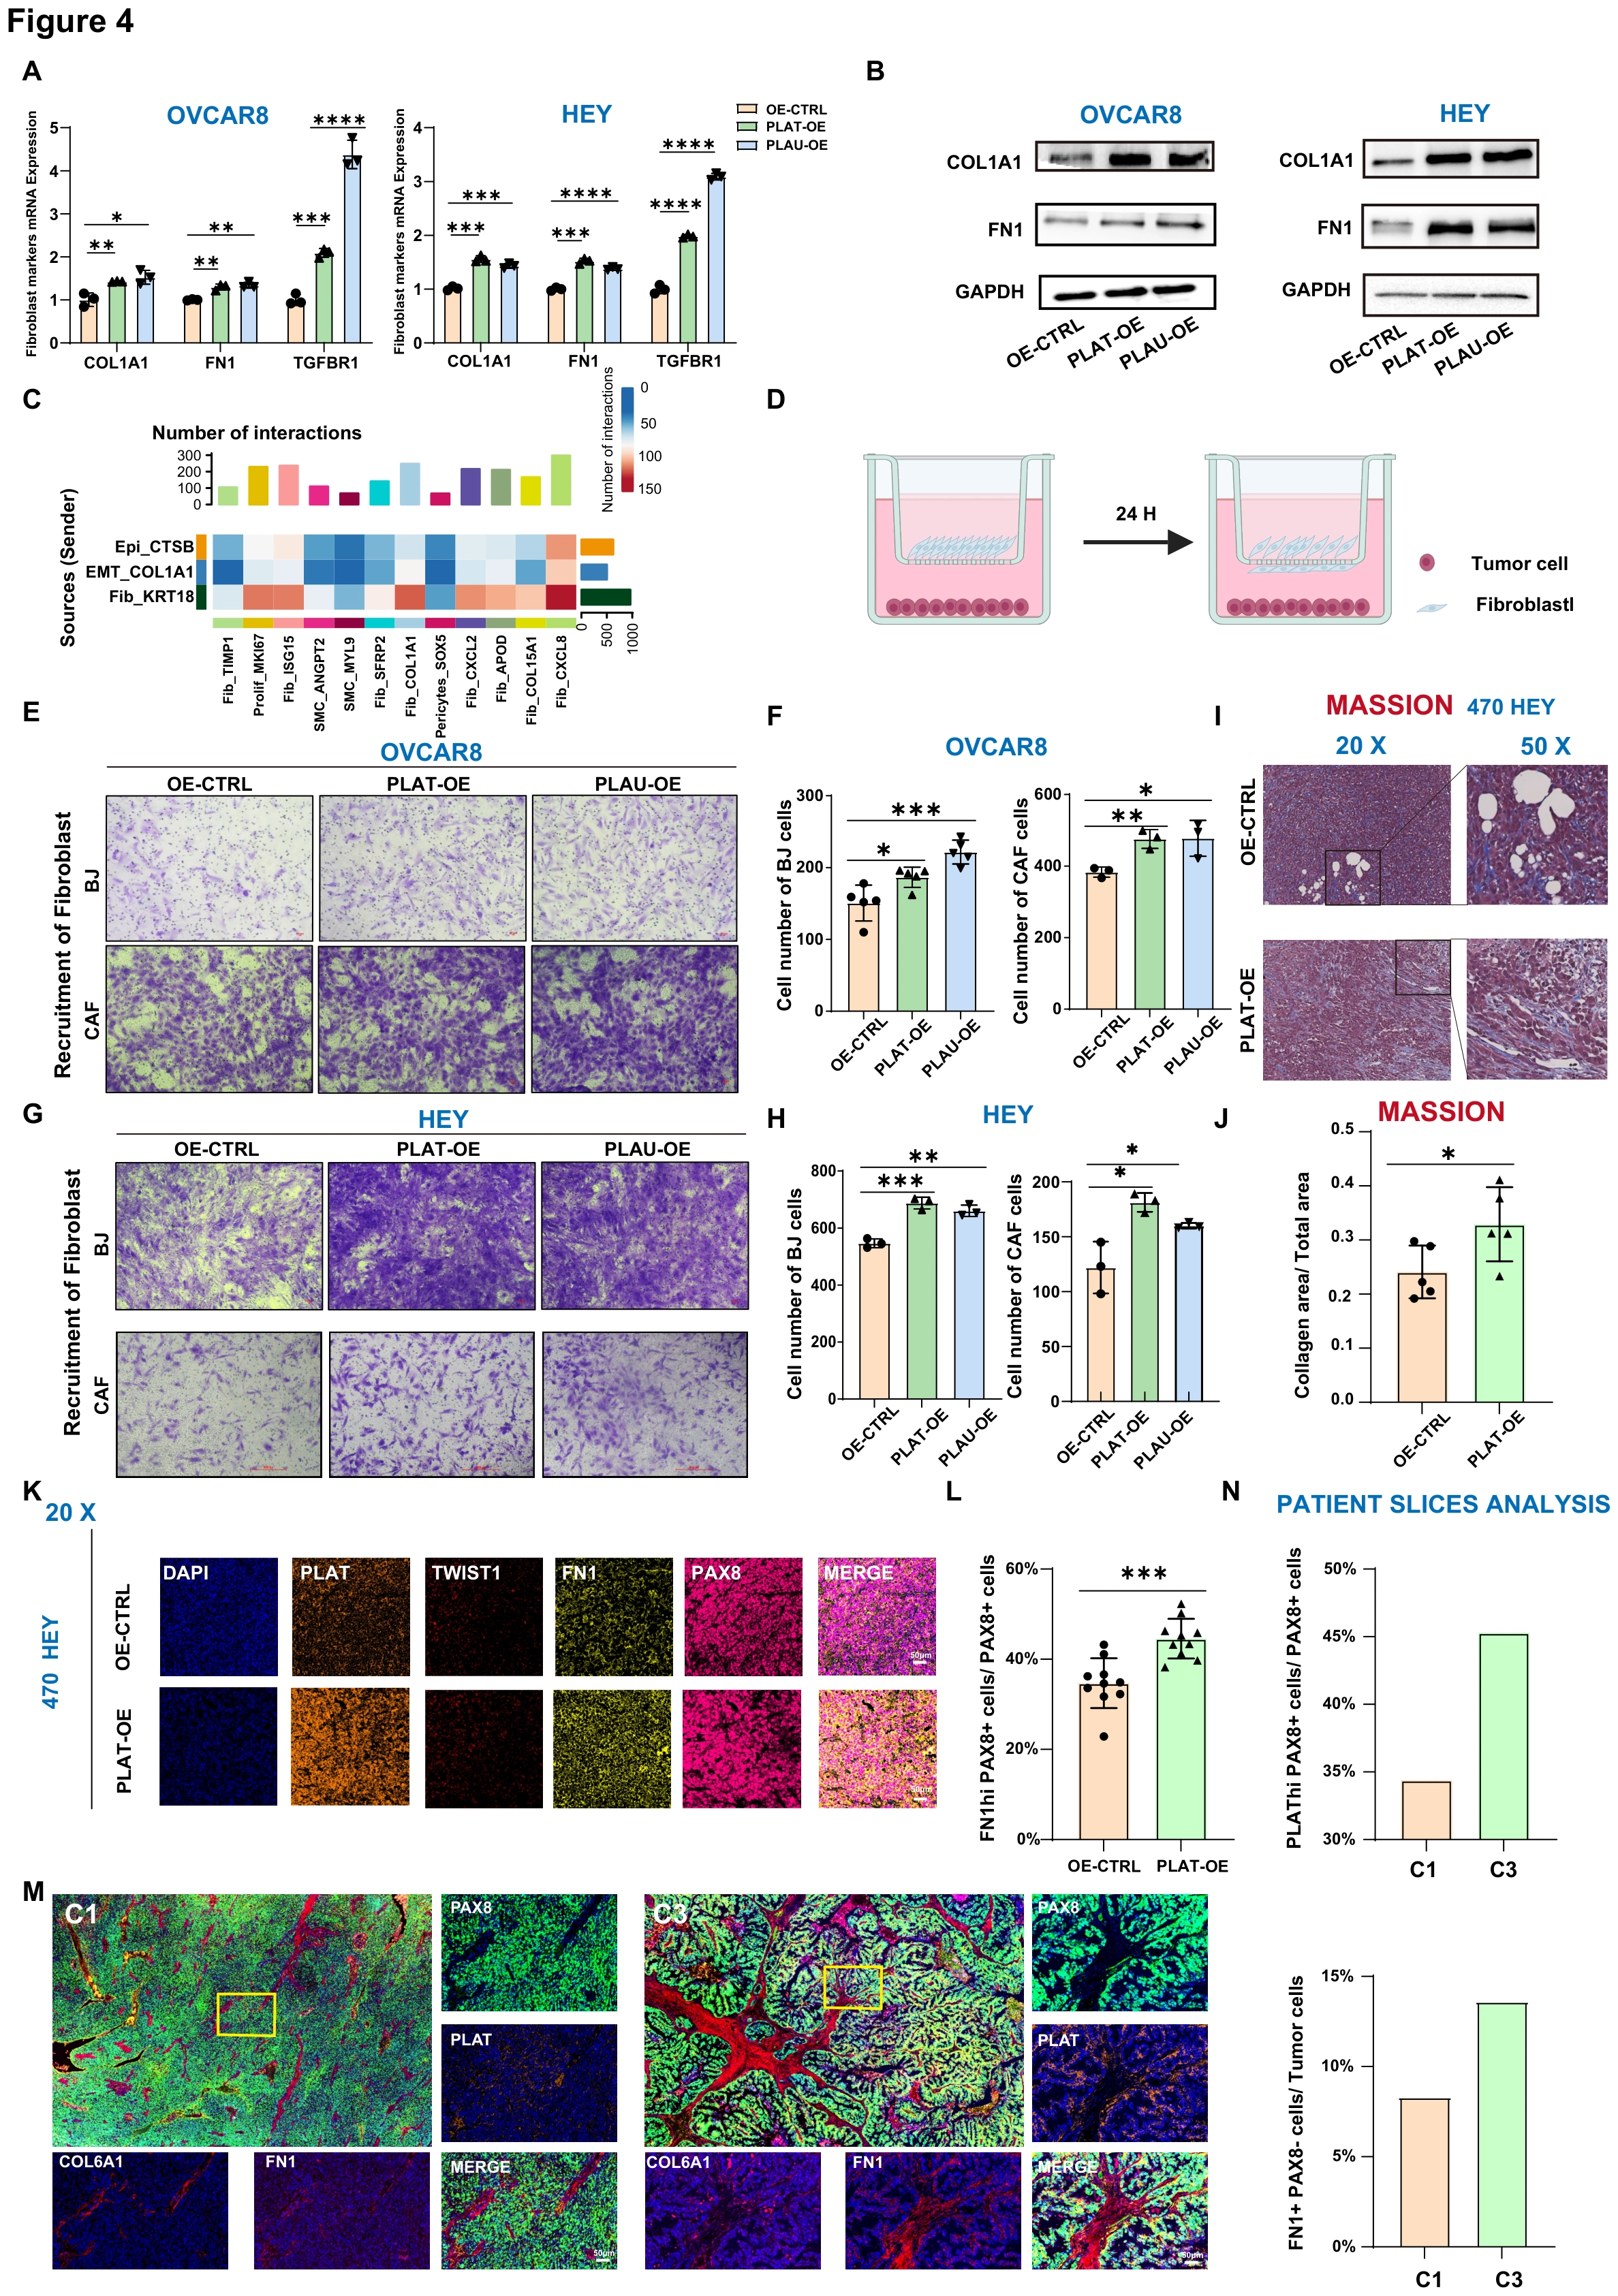
Malignant transformation of ovarian cancer cells is associated with their own fibroblastic transition
Following the tumor-cell functional tests, this figure examines effects on fibroblasts and tissue matrix. A–B assess fibroblast-associated programs, C–H move from interaction clues to recruitment assays, and I–N inspect collagen deposition and marker expression in mouse and patient tissue.
A–BExamine fibroblast-associated molecular programs
qPCR and Western blot validation of fibroblast-associated gene expression in ovarian cancer cell lines with gene overexpression. This tests acquisition of an associated program without equating it with conversion into a normal fibroblast.
CInvestigate tumor–fibroblast interaction candidates
Crosstalk analysis revealing interactions between ovarian cancer cells and fibroblasts during the fibrotic transition. The interaction analysis motivates the experimental recruitment test in D–H.
DDefine the recruitment comparison
Schematic illustration of the fibroblast recruitment assay. The arrangement of the assay clarifies the origin of the recruitment readouts in E–H.
E–HMeasure fibroblast recruitment
Representative images and quantification of fibroblast (BJ and HOCFI) recruitment induced by ovarian cancer cells with gene overexpression. Images and counts across models move beyond predicted interactions to an experimental cellular response.
I–JExamine collagen deposition in vivo
Masson’s trichrome staining showing increased collagen deposition in subcutaneous tumors derived from PLAT-overexpressing cells. Matrix staining asks whether the recruitment-related hypothesis is accompanied by altered tissue environment.
K–LCheck fibroblast-associated markers in tumors
Fibroblast-associated gene expression and quantification in tumor sections from the subcutaneous HEY xenograft model (#470). This adds marker-level evidence alongside collagen staining in vivo.
M–NReturn to tissue from contrasting patient subtypes
Representative staining images and quantitative analysis of tumor sections from C1 (P1) and C3 (P5) subtype patients. P ≤ 0.05 was considered statistically significant and was represented with * for P ≤ 0.05, ** for P ≤ 0.01, *** for P ≤ 0.001, and **** for P ≤ 0.0001, and ns for unsignificant. This reconnects the model experiments to the original clinical C1–C3 subtype comparison.
Takeaway
The completed figure sequence connects patient subtyping, tumor-cell state and matrix changes: the candidate program is examined both within tumor cells and through intercellular interactions. Recruitment assays, tissue staining and clinical subtype associations address different parts of that argument rather than substituting for one another.
My contribution
As a coauthor, I contributed experimental work and participated in manuscript preparation, editing and review. My experimental experience includes KLF6-knockout cell-line generation, qPCR and Western blot measurements, and proliferation, invasion and migration assays.
Outcomes & record
The study links PLAT/PLAU-associated fibroblast-like tumor states to extracellular-matrix remodeling and fibroblast recruitment, with functional evidence for TWIST1–SEMA3C–NRP2 paracrine signaling. Clinical cohorts show prognostic associations; biomarker applications require further validation.
The manuscript “PLAT drives fibrotic reprogramming via paracrine TWIST1–SEMA3C–NRP2 axis in high-grade serous ovarian cancer” was submitted to Science Advances and is under review. I am a coauthor.