Biomed / 05
Heterogeneity of circulating GTN cells
Worked on clinical sample processing, microfluidic CTC isolation, SMART-seq3 library preparation and functional validation using knockout and overexpression cell lines. Drafted most of the manuscript and created most figure panels. Manuscript under review.
- Publication status
- Under review
- Submitted to
- Genome Medicine
- Authorship
Abstract
Gestational trophoblastic neoplasia (GTN) is caused by cancerous transformation of placental trophoblastic cells, which can undergo hematogenous spread via circulating tumor cells (CTCs). Due to limited accessibility to tumor tissues, the molecular classification and metastatic evolutionary dynamics of GTN progression remains poorly defined. Combining microfluidic isolation and single-cell omic profiling of CTCs and patient-matched tumor cells from GTN blood and tissue biopsies respectively, we revealed profound molecular and functional heterogeneities among individual patients. Three distinct GTN molecular subtypes were identified and validated in clinical samples, including cilia-like subtype marked by FOXJ1 positivity, tuft cell-like subtype driven by POU2F3, and a senescent subset with elevated BHLHE41 expression.
Experimental analyses using GTN cell line models confirmed a central role of POU2F3 in driving epithelial–mesenchymal transition (EMT), migration, invasion, and tumorigenesis in vivo. Furthermore, BHLHE41 overexpression is sufficient to drive p53/p21 activation and senescence induction, characterized by β-Galactosidase formation and elevated expression of the senescence-associated secretory phenotype (SASP) signatures. In a prospective cohort of patient blood samples, CTCs overexpressing POU2F3 or BHLHE41 were significantly elevated in the GTN group compared to the benign hydatidiform moles (HM) cases, implicating their translational potential as single-cell liquid biopsy for accurate molecular subtyping and prediction of GTN progression in the absence of tissue biopsies.
Figures
Single-cell omic analysis of GTN CTC heterogeneity and evolutionary dynamics
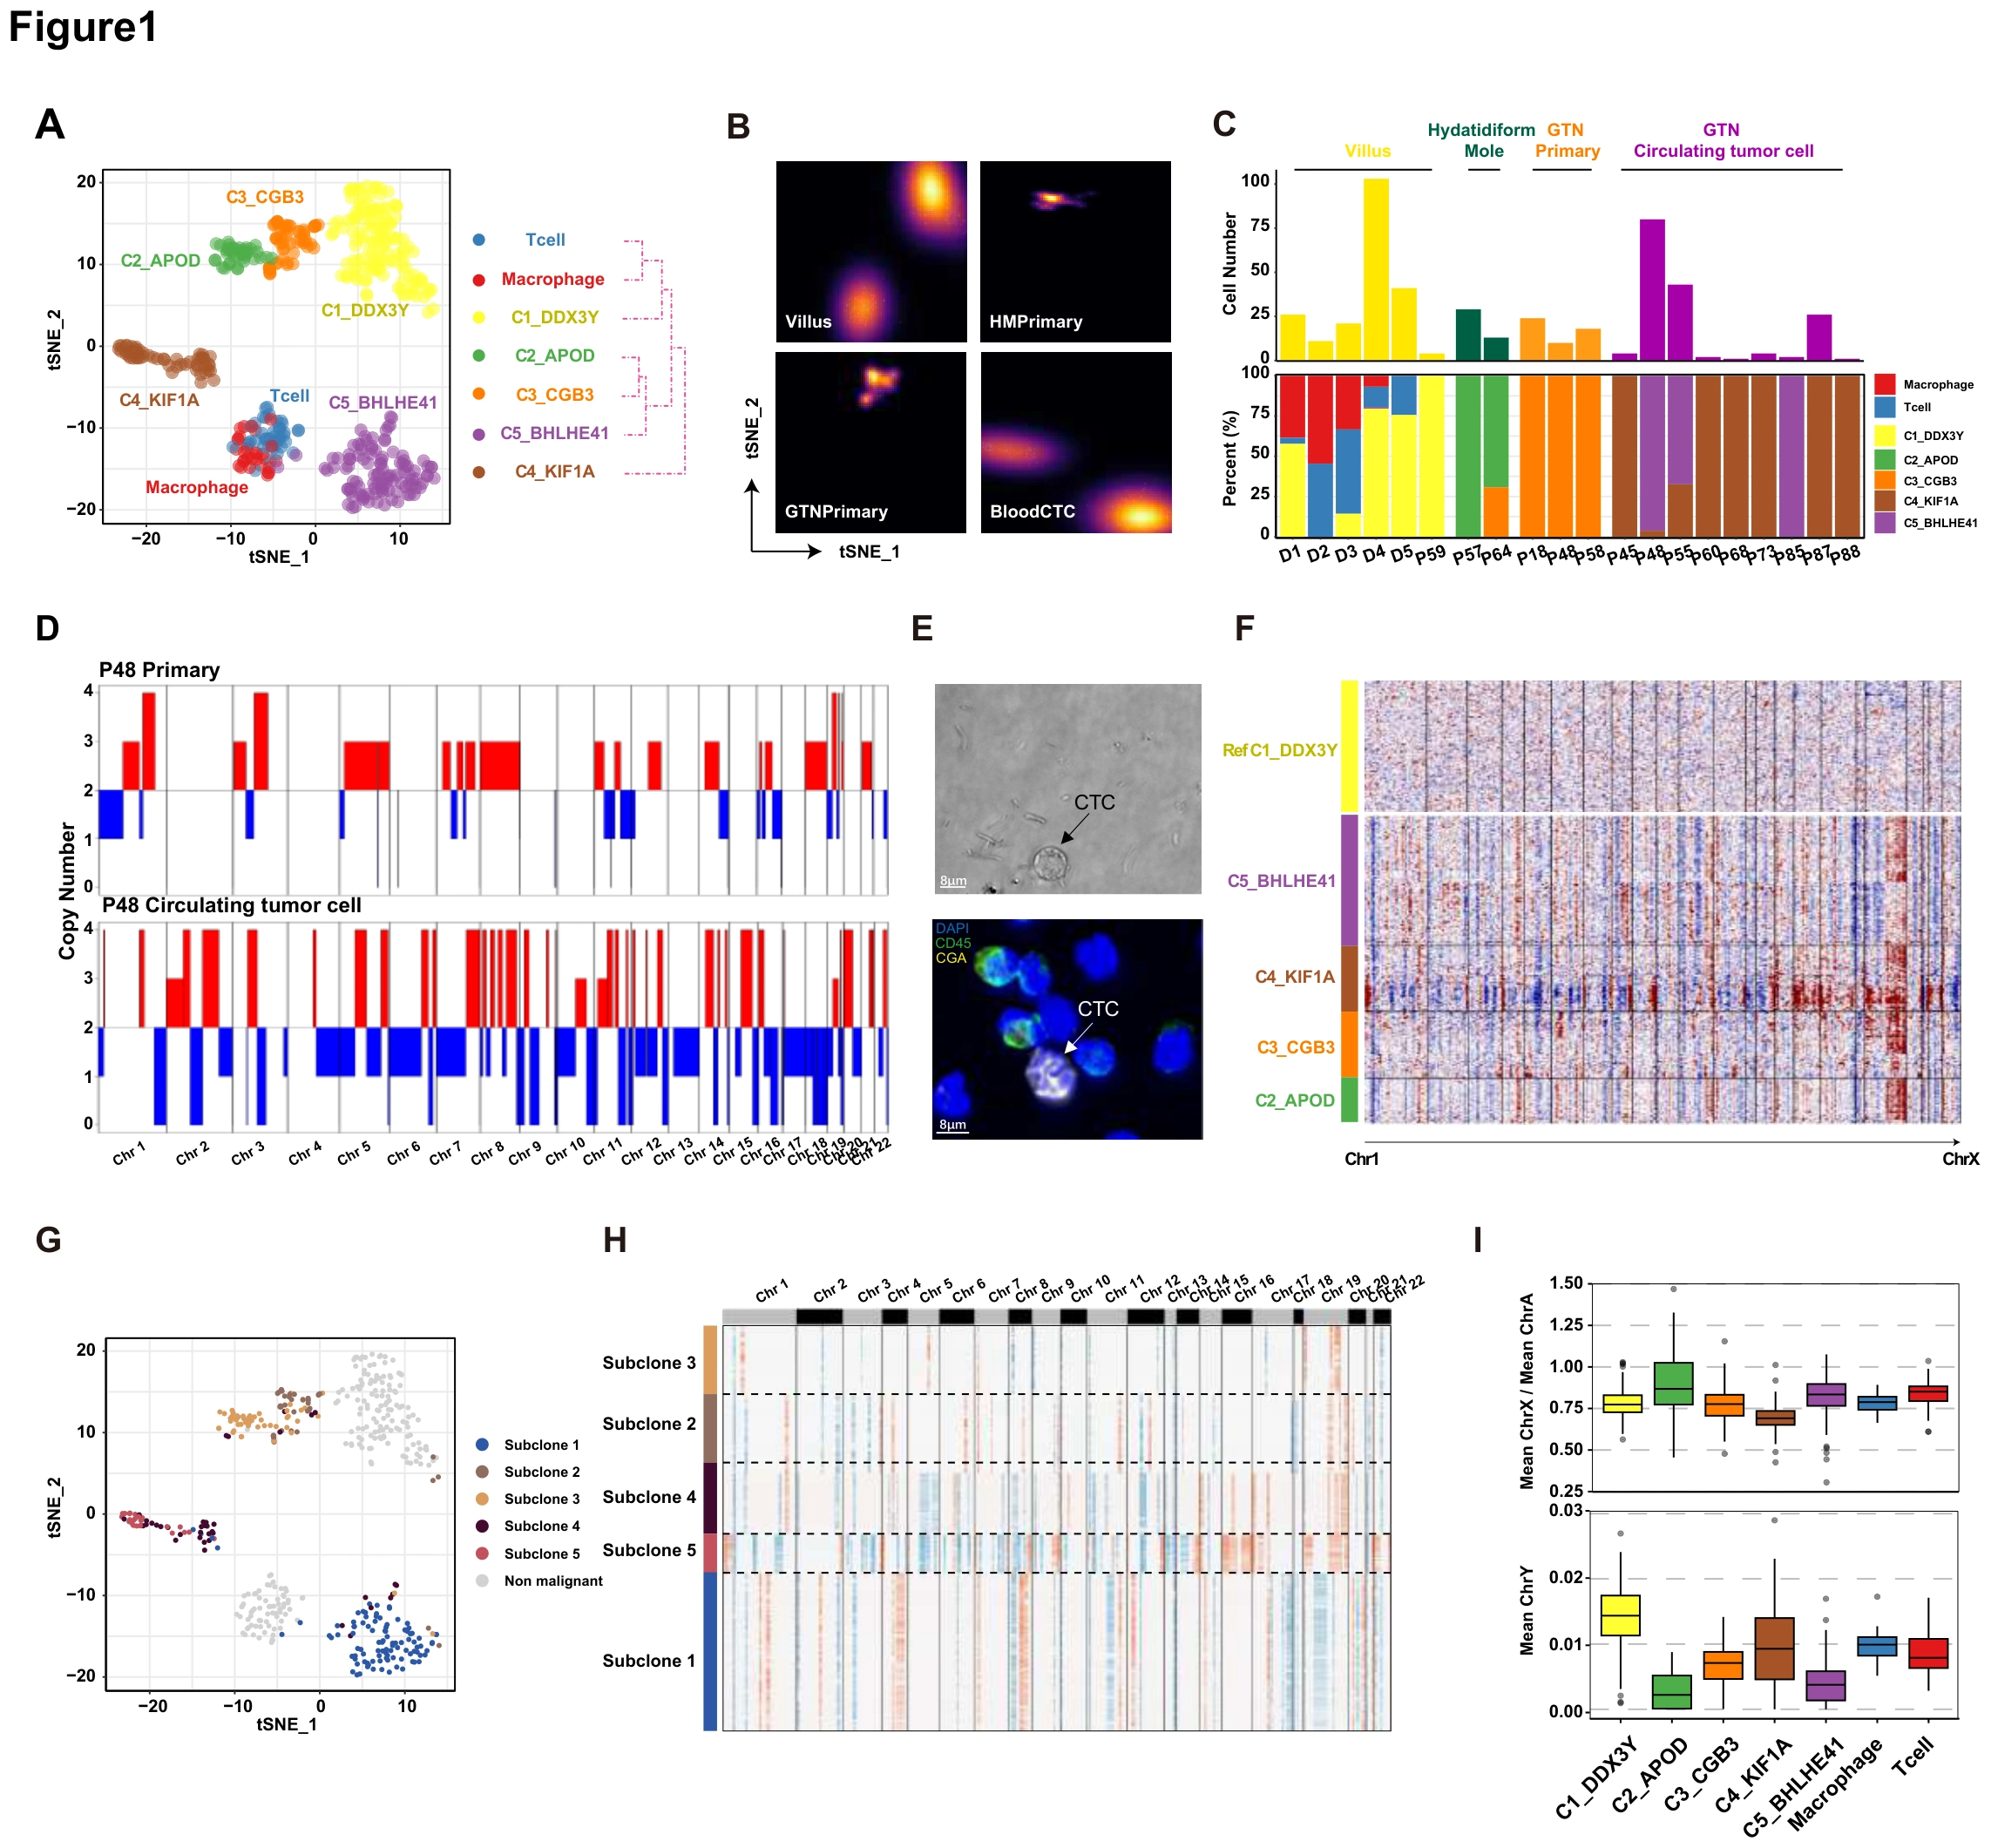
Because access to GTN tissue is limited, the study first establishes a framework in which blood-derived cells can be compared with tissue. A–C map states, sample origins and patient composition, D–H examine copy-number and clonal features, and I adds sex-chromosome expression context.
ADefine the single-cell framework
The t-SNE plot of single-cell unsupervised clustering of gestational trophoblastic disease. Each dot indicated a single cell. Color-coded for the cell type. The populations provide the starting framework for subtyping; spatial separation alone does not establish functional differences.
BRelate states to sample origin
The t-SNE plot of tissue origin from GTD patients. Using the same atlas as A lets the reader compare the distribution of blood- and tissue-derived cells.
CCheck patient composition and sampling
A stacked graph of the distribution of the proportion of cells in each subpopulation of all patients and a bar graph of the number of cells in patients. Reading proportions with counts helps distinguish sampling depth from biological differences in population abundance.
DCompare tissue and CTC copy-number profiles
The heatmap shows the CNV of the primary tumor and CTC of P3 patients. Red represents amplification, and blue represents deletion. The within-patient comparison places blood and tissue cells in a shared genomic context.
ECheck blood-cell morphology and markers
The upper photograph displays the bright-field image of CTC from patient; the lower photograph displays the mIF staining of CGA in patient CTCs. Morphology and CGA staining add an observational check on the profiled blood-cell identities.
FCompare genomic features across states
The heatmap shows the CNV of each subcluster of GTD cells. Red represents amplification, and blue represents deletion. This connects transcriptional states in A with heterogeneity at the copy-number level.
GInfer candidate clonal relationships
The t-SNE plot characterizes the clonal structure of each subpopulation by SCEVAN. Transcriptional similarity need not imply a single clone, motivating this additional analytical dimension.
HInspect the copy-number basis of clones
Characterize copy number variation of cell subsets of clonal structures by SCEVAN. Read with G to inspect genomic patterns underlying the inferred clones rather than only their labels.
IAdd sex-chromosome expression context
The box plot shows the proportion of X chromosome and autosomal expression and the expression of the Y chromosome in each subpopulation. These measurements add origin-related context without serving as a sole identity or lineage assignment.
Takeaway
The figure establishes which cells were profiled, where they came from and their genomic context, without treating clustering itself as functional proof. Figure 2 begins the subtype-level interpretation with the cilia-like state.
Identification and characterization of Cilia-like GTN subtype
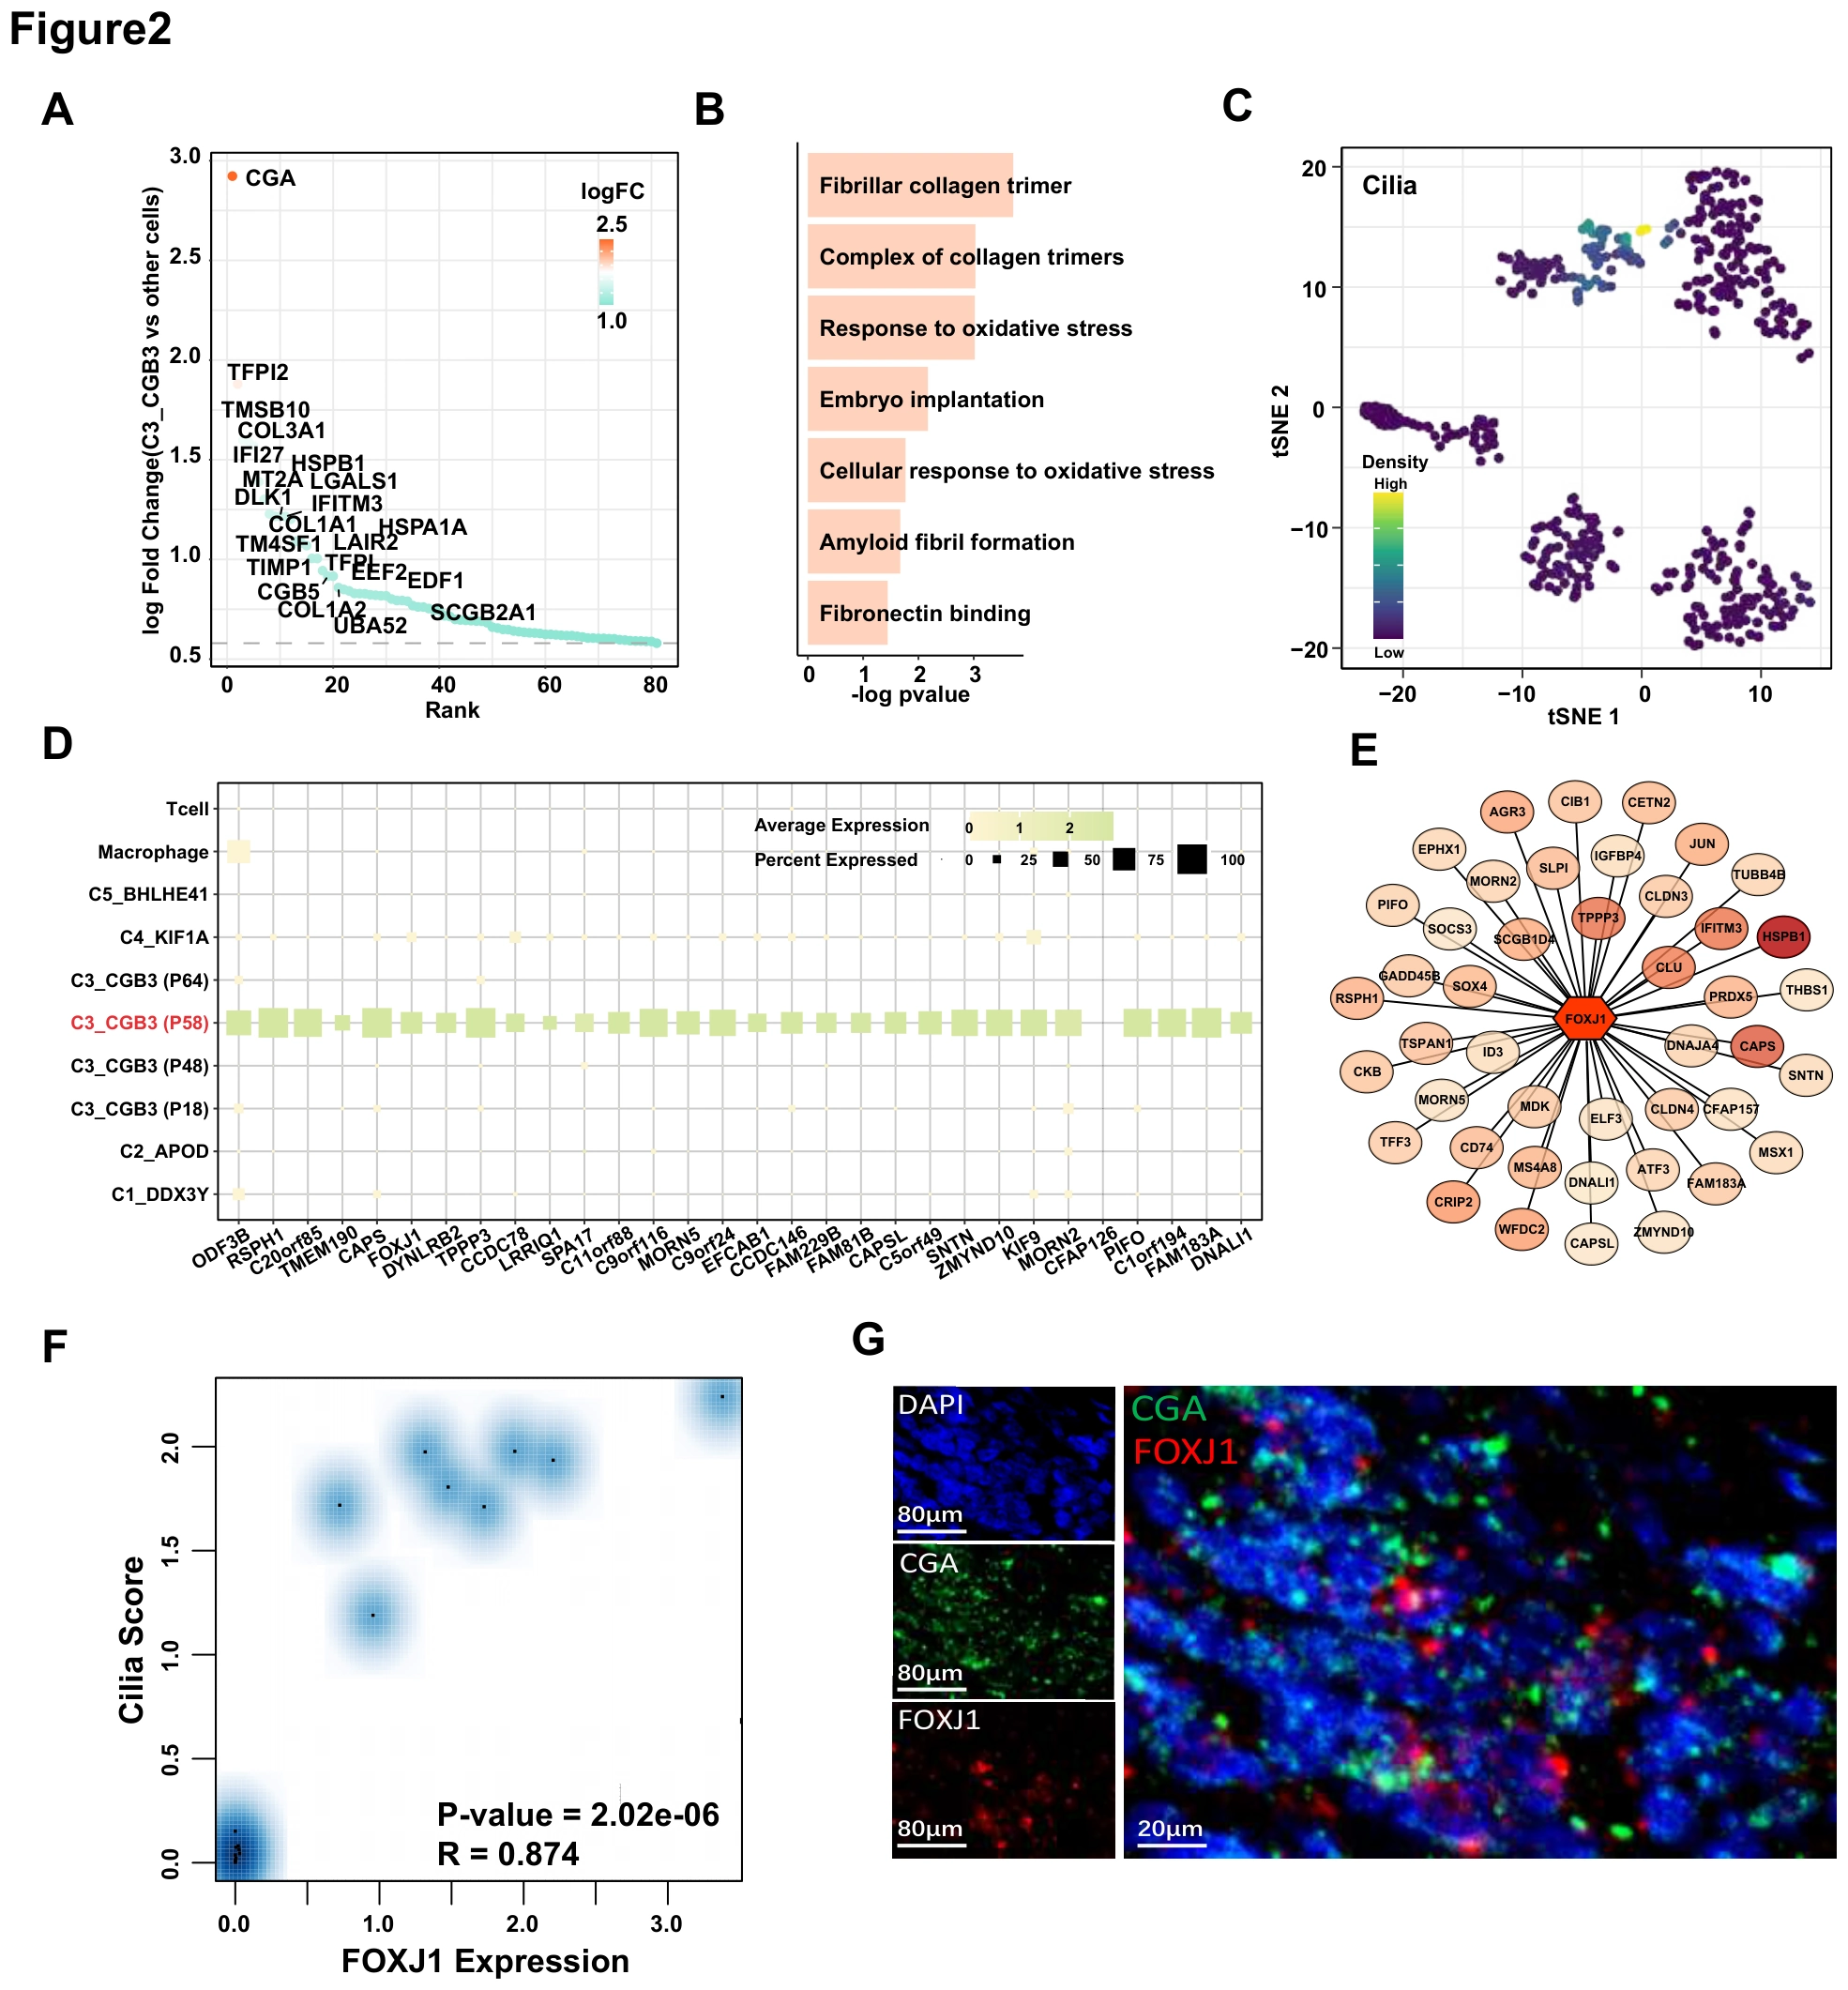
With the GTN atlas established, this figure asks whether one population can be interpreted as cilia-like. A–D connect differential genes with pathways and marker programs, E–F examine FOXJ1, and G uses multiplex staining to return the transcriptomic hypothesis to cellular and tissue evidence.
AIdentify population-specific genes
The dot plot shows the specific expression genes of the C3_CGB3 subpopulation. This first defines how the population differs transcriptionally from the other states.
BTranslate gene differences into programs
Pathway enrichment results for C3_CGB3 subgroup-specific differentially expressed genes. Enrichment asks whether the genes in A point to a coherent biological program.
CMap the ciliary program onto the atlas
The t-SNE plot shows the calculated fraction of the ciliary pathway in each subpopulation of GTD. The score locates the program across cells rather than only reporting an enriched term.
DCheck the broader marker program
Expression levels of ciliated epithelial-specific genes in GTD subpopulations. Concordant expression across several genes supports a broader basis for the cilia-like interpretation.
ENominate regulatory factors
Transcription factor analysis of gene-specific expression of ciliated epithelial cells. This moves from state markers to transcription factors that may organize the program.
FRelate FOXJ1 to the ciliary program
Correlation analysis of cilia score and FOXJ1 expression. The correlation links FOXJ1 to the program without being equivalent to a perturbation experiment.
GComplement transcription with staining
Multiplex immunofluorescence staining was performed for DAPI (blue), FOXJ1 (red), CGA (green); each stain was shown separately and merged. Separate FOXJ1, CGA and merged channels connect the markers at the cellular level.
Takeaway
The subtype interpretation rests on correspondence among genes, pathways, transcription factors and staining, rather than one highly expressed marker. Figure 3 follows a similar discovery-to-validation logic for the POU2F3-associated tuft-like state and its function.
Identification and functional validation of POU2F3-driven tuft-like GTN subtype
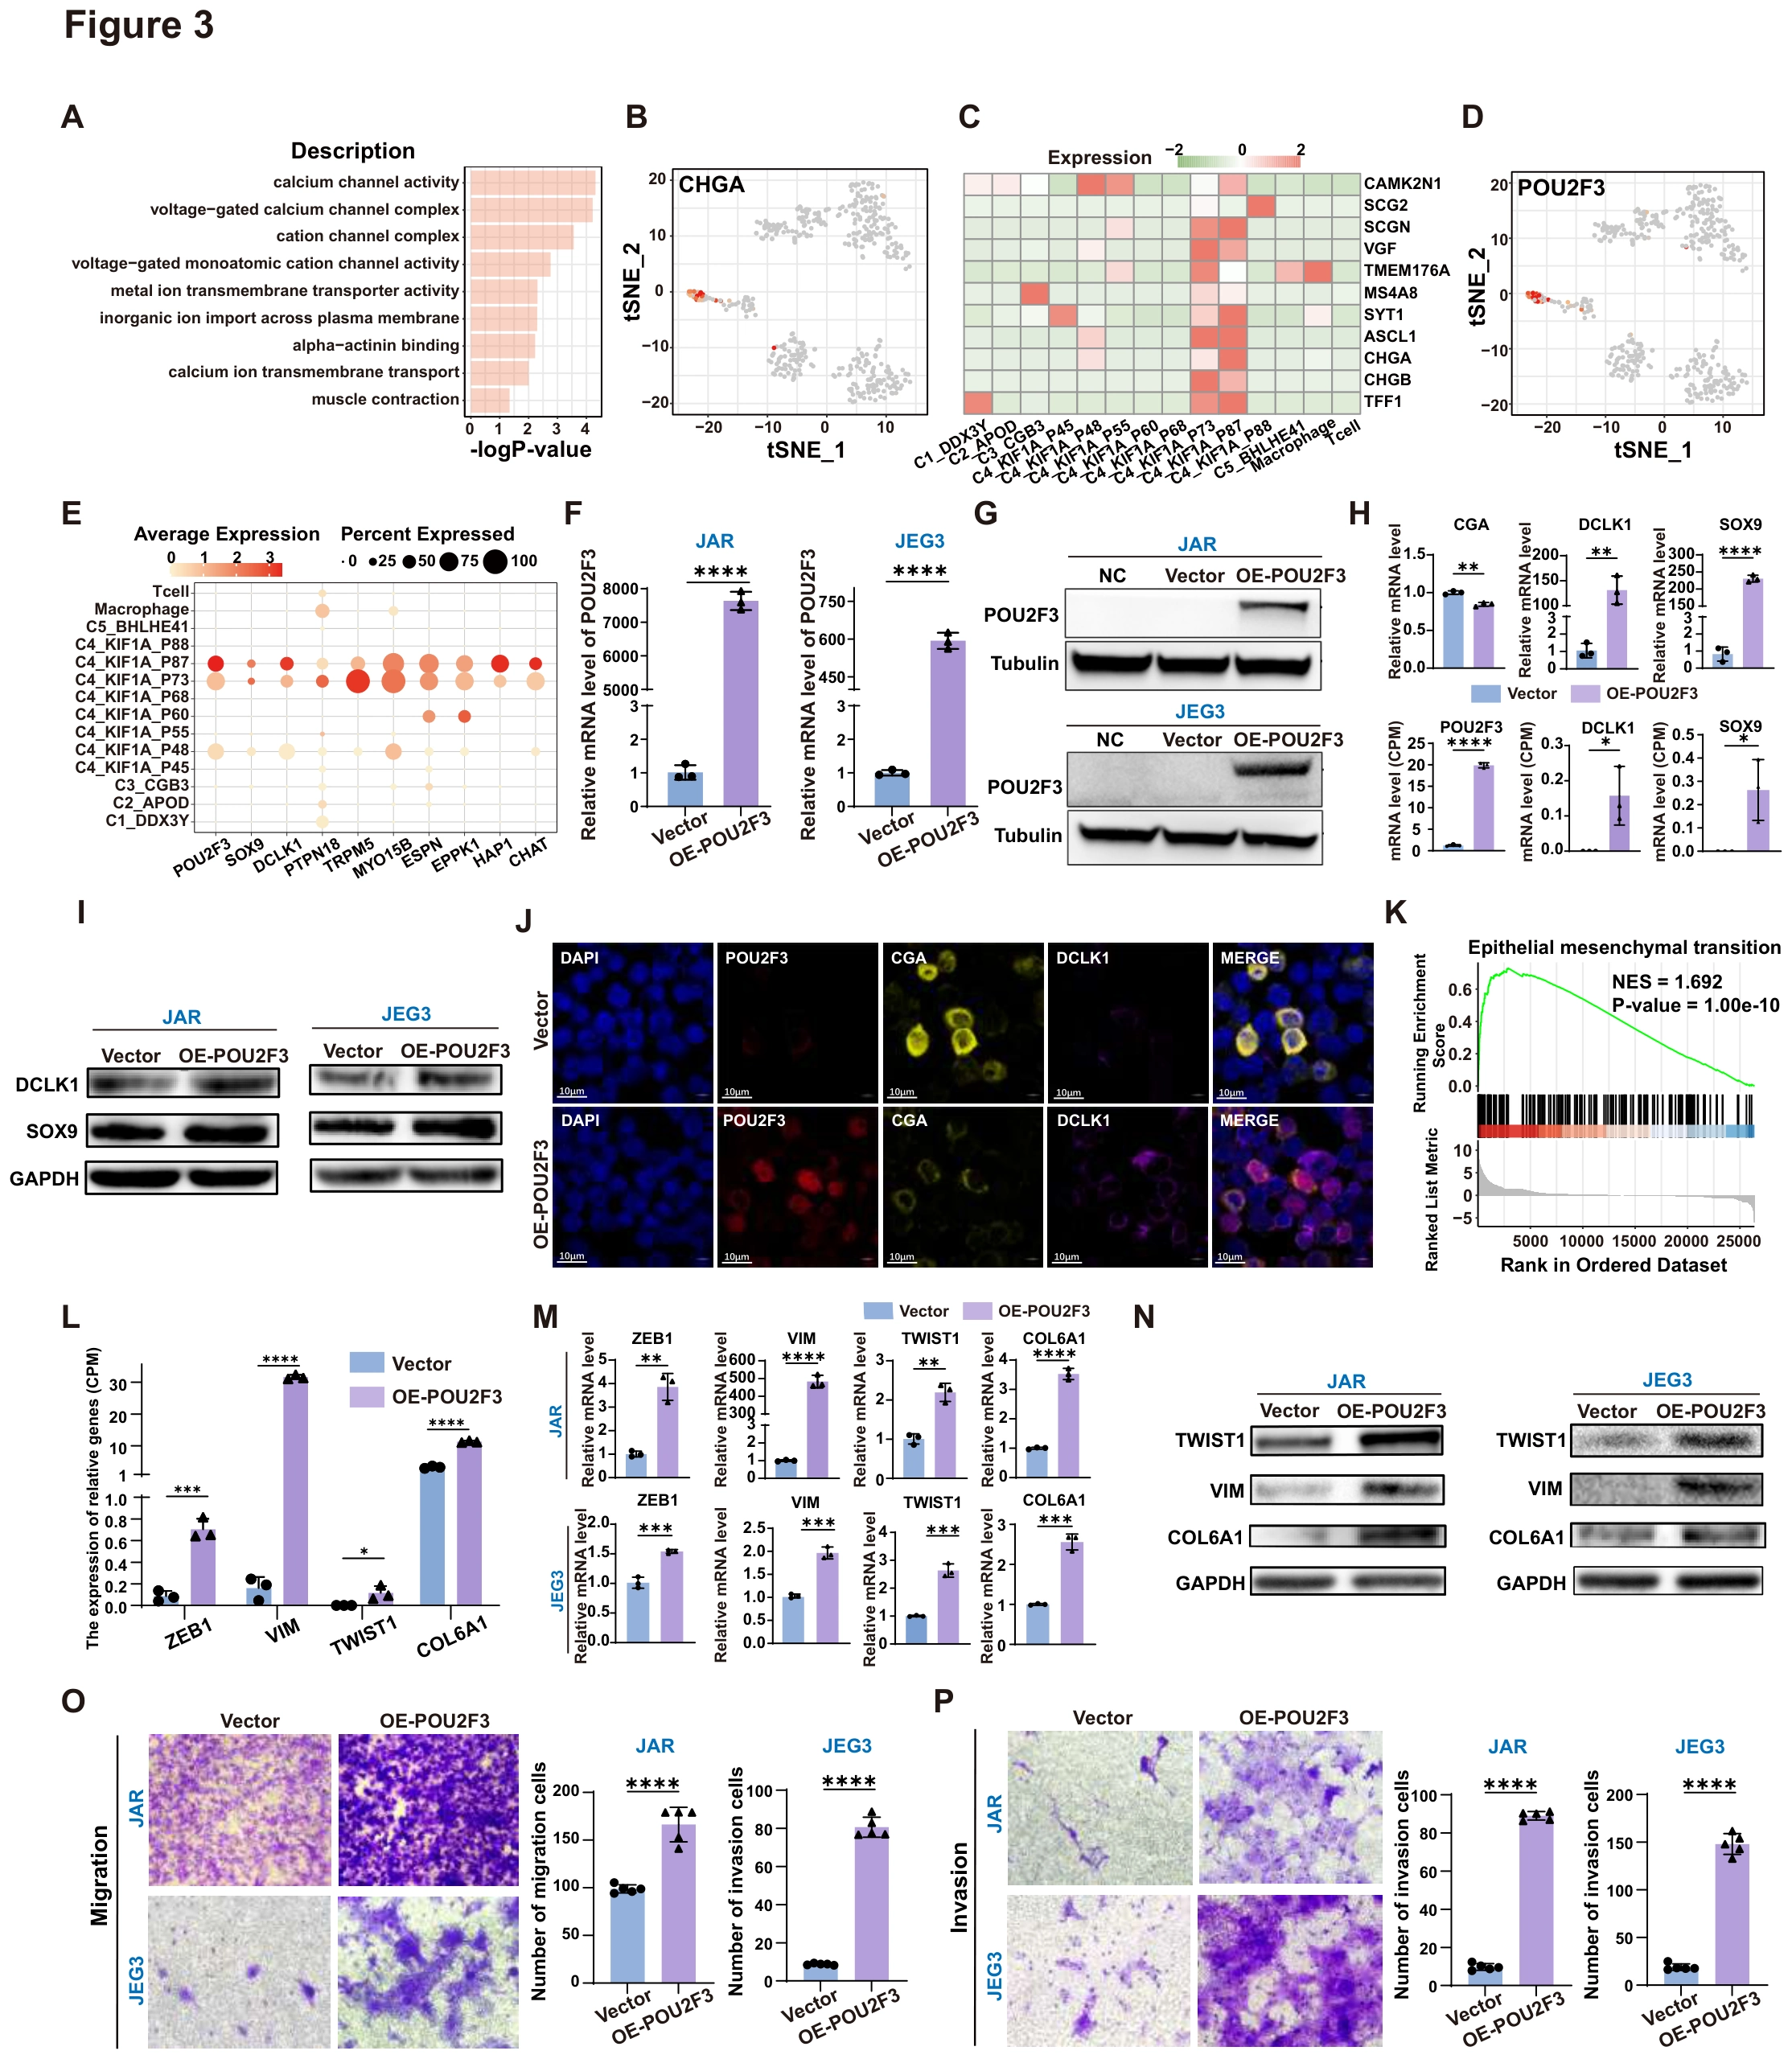
This figure first distinguishes neuroendocrine-associated signals from POU2F3/tuft-like features, then asks what increasing POU2F3 does to GTN cells. A–E establish identity clues, F–J validate the perturbation and markers, and K–P connect expression changes to EMT, migration and invasion.
AFrame the population-identity question
Pathway enrichment results for C4_POU2F3 subcluster-specific differentially expressed genes. Pathway clues motivate marker checks rather than defining cellular identity by an enriched term alone.
BInspect CHGA distribution
The t-SNE plot shows the expression of CHGA. This provides one reference for distinguishing related but nonidentical cellular programs.
CCompare a neuroendocrine marker program
Expression levels of neuroendocrine signature genes in GTD subclusters. Together with B, this avoids equating one marker with an entire neuroendocrine state.
DLocate the POU2F3-associated state
The t-SNE plot shows the expression of POU2F3. Mapping POU2F3 specifies the candidate population motivating the later functional experiments.
ECheck the tuft-like marker program
The dot plot shows the expression of the tuft cells genes in GTD subclusters. Read with D to examine whether POU2F3 accompanies a broader marker program.
FValidate the transcript perturbation
The mRNA levels of POU2F3 in Vector and OE-POU2F3 group in JAR and JEG3 cell lines. ****, P < 0.0001. The subsequent functional comparisons depend on establishing an effective overexpression perturbation.
GValidate the protein-level perturbation
The protein levels of POU2F3 in NC, Vector and OE- POU2F3 group in JAR and JEG3 cell lines. Protein validation complements F by checking that the perturbation extends beyond RNA abundance.
HMeasure tuft-associated transcript responses
Histogram of the RNA levels of tuft cells genes (including DCLK1, SOX9, and POU2F3) in Vector and OE-POU2F3 group of JAR cells. **, P < 0.01; ****, P < 0.0001. This asks whether increasing POU2F3 also changes associated markers rather than only POU2F3 itself.
ICheck marker-protein responses
The protein level of tuft cells genes (including DCLK1, SOX9, and POU2F3) in Vector and OE-POU2F3 group of JAR and JEG3 cells Together with H, this assesses the state-associated response at transcript and protein levels.
JObserve marker combinations in cells
Multiplex immunofluorescence staining was performed for DAPI (blue), POU2F3 (red), CGA (yellow), and DCLK1 (purple) in the Vector group and OE-POU2F3 group of GTN cell line; each stain was shown separately and merged. Separate and merged channels complement bulk measurements with cellular-level observations.
KNominate the EMT connection
The enrichment of the Epithelial-mesenchymal transition (EMT) pathway in OE-POU2F3 GTN cell line. Post-perturbation enrichment proposes an explanation to test through migration and invasion assays.
LIdentify EMT-associated expression changes
Histogram shows the expression of EMT related genes (including ZEB1, VIM, TWIST1, and COL6A1) in the Vector and OE-POU2F3 GTN cell line. Histogram shows bulk RNA-seq data. *, P < 0.05; ***, P < 0.001; ****, P < 0.0001. Individual genes connect the pathway-level result to the independent validation that follows.
MRecheck transcript responses by qPCR
Histogram of the RNA levels of EMT related genes (including ZEB1, VIM, TWIST1, and COL6A1) in Vector and OE-POU2F3 group of JAR and JEG3 cells. **, P < 0.01; ****, P < 0.0001. Validation in two cell lines complements the sequencing-based measurements in L.
NTest the protein-level EMT response
The protein levels of EMT related genes in Vector and OE- POU2F3 group in JAR and JEG3 cell lines. Protein results test whether the transcriptional program is reflected in its molecular effectors.
OMeasure migration behavior
Results of the cell migration experiment in Vector and OE-POU2F3 group of JAR and JEG3 cells. ****, P < 0.0001. This tests whether the EMT-associated molecular changes accompany altered cell motility.
PExtend testing to invasion
Results of the cell invasion experiment in Vector and OE-POU2F3 group of JAR and JEG3 cells. ****, P < 0.0001. Distinct from O, the invasion assay adds a barrier-traversal requirement.
Takeaway
The figure goes beyond naming a tuft-like state by testing its molecular and behavioral relationship to POU2F3 perturbation. Figure 4 extends this in vitro evidence to tumor models and clinical blood samples.
POU2F3 overexpression enhances tumorigenesis in vivo and the fraction of POU2F3+ CTCs is associated with disease progression
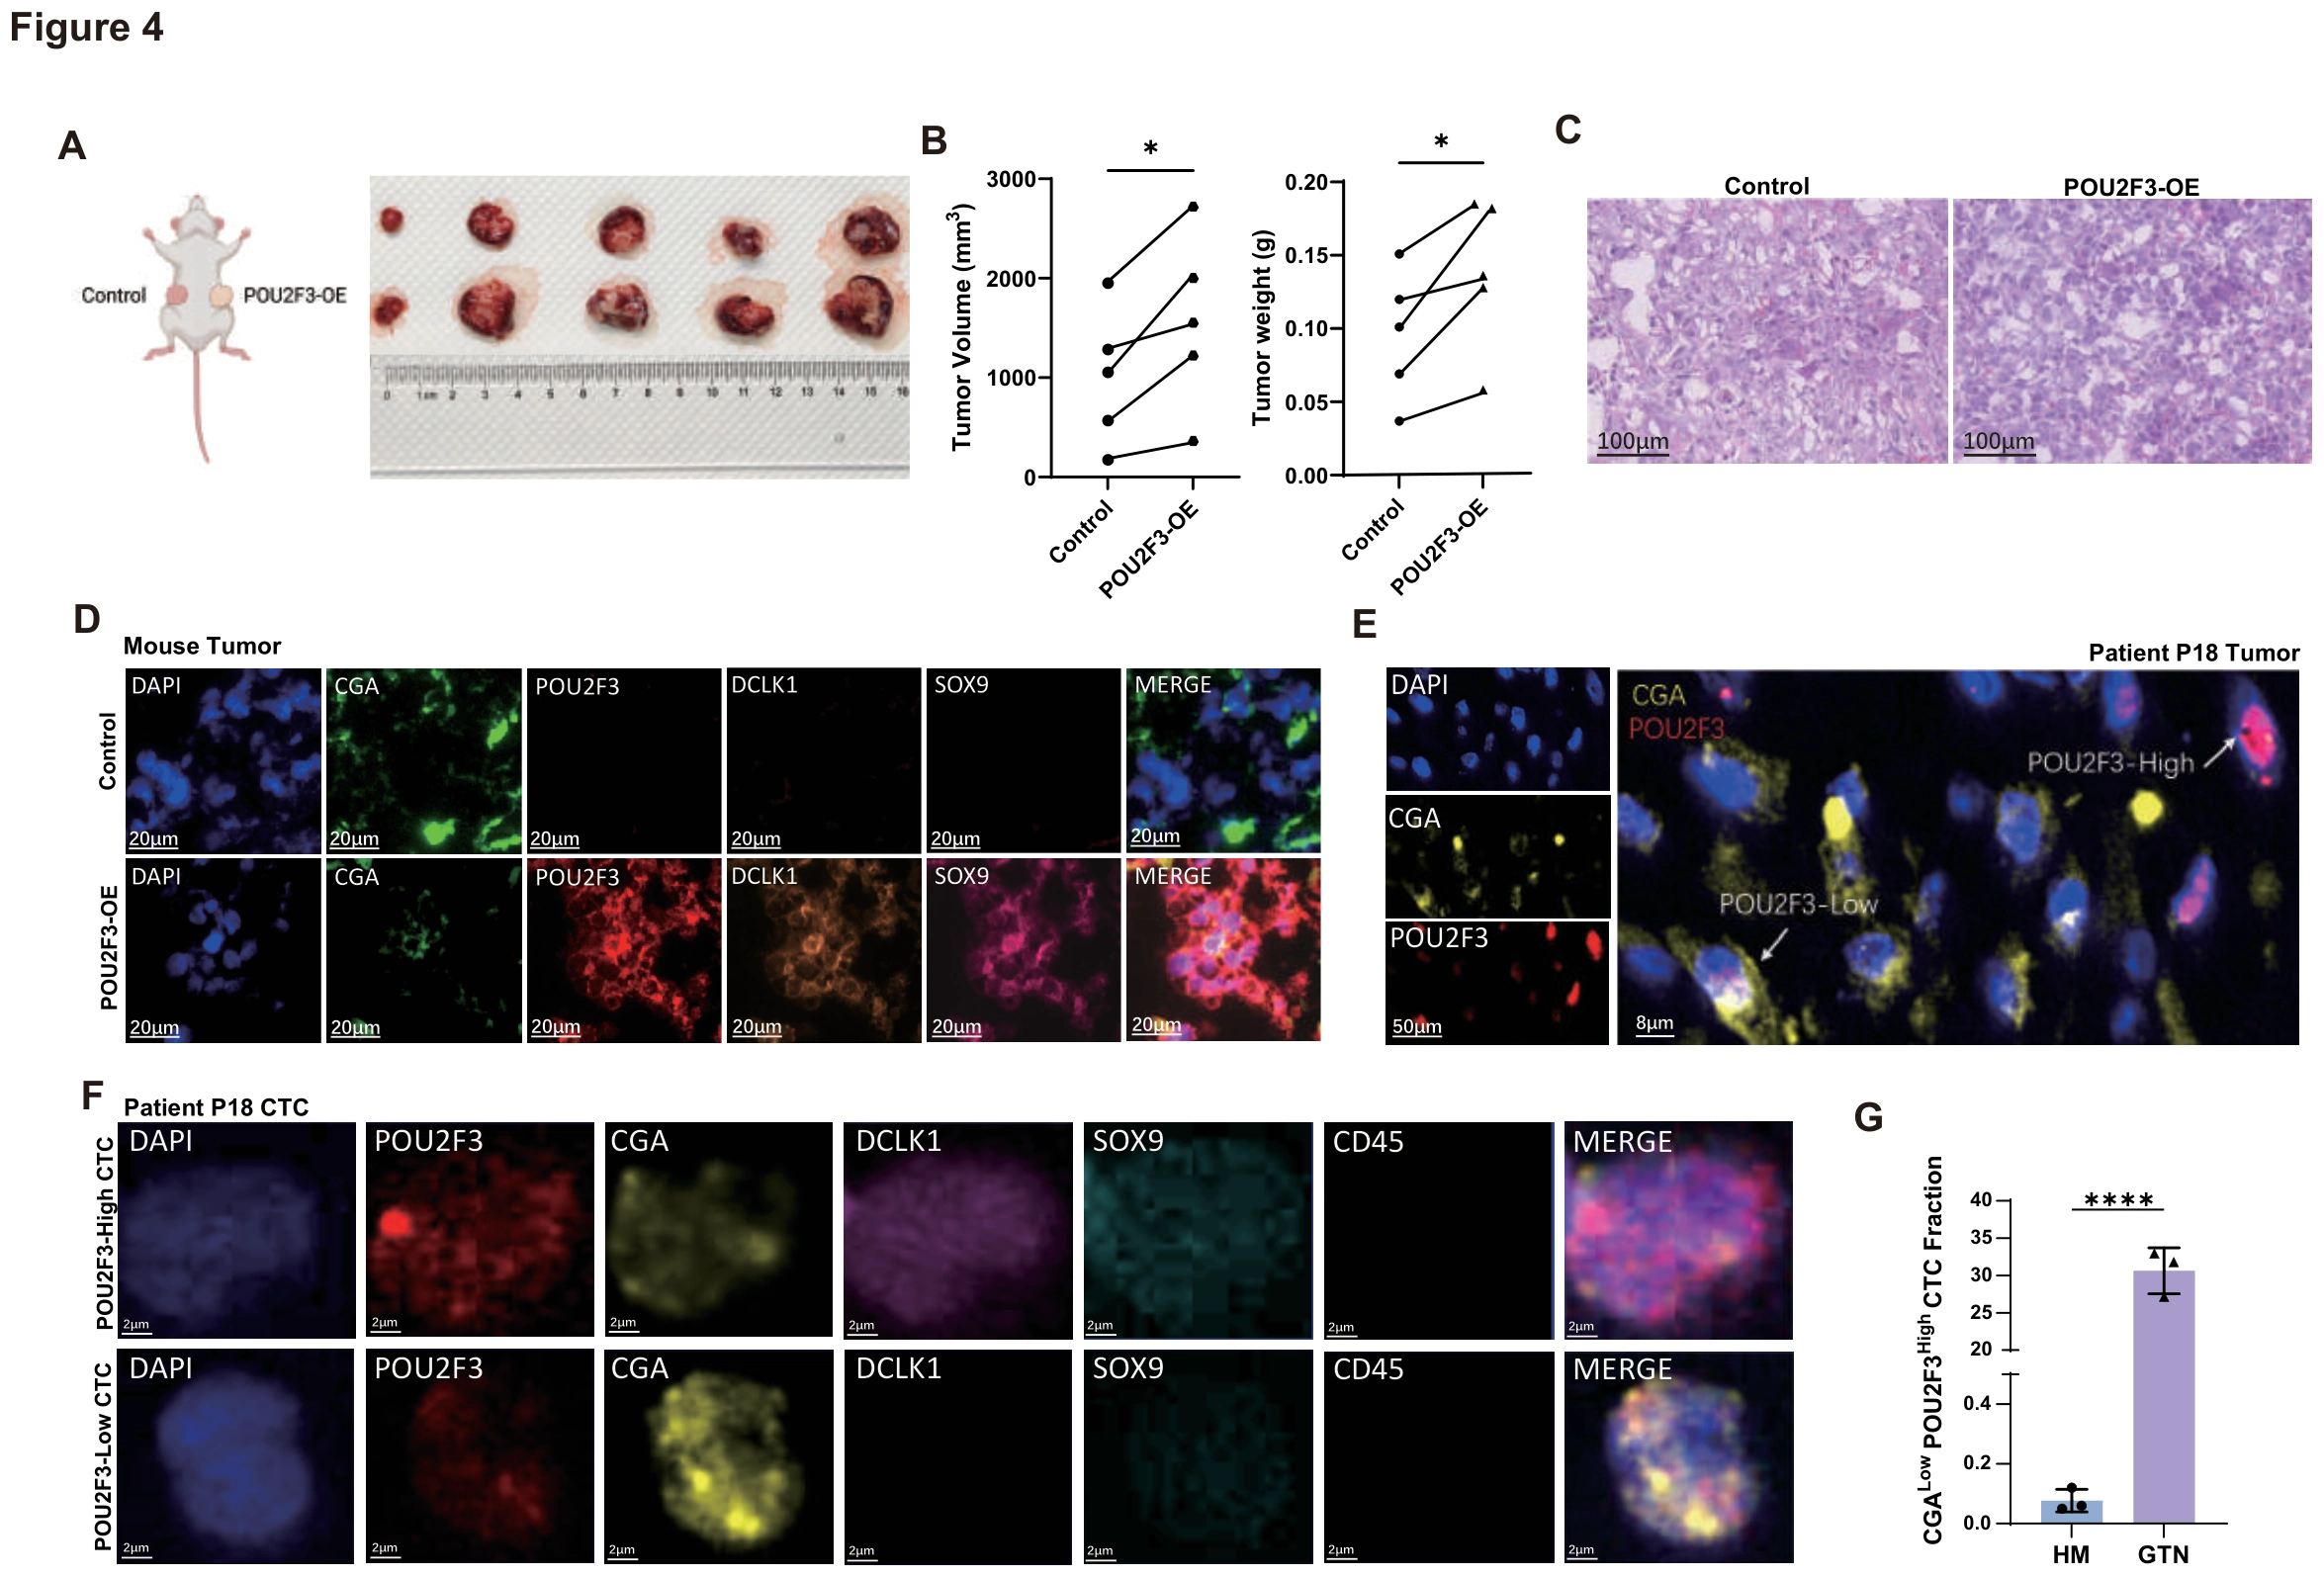
Following the cultured-cell results, this figure examines in vivo and clinical correspondence. A–D use paired xenografts and tissue staining, E–F inspect marker combinations in patient tissue and blood, and G compares the corresponding CTC fraction between HM and GTN.
AEstablish a within-mouse comparison
Images of bilateral subcutaneous xenografts generated by injecting Vector and POU2F3-overexpressing JAR cells into opposite flanks of the same mouse. Opposite-flank injections hold the host background constant within each paired comparison.
BQuantify the paired tumors
Paired quantification of tumor weight from the xenografts shown in (A). *, P < 0.05. Paired weights provide the quantitative evidence alongside the representative images in A.
CInspect xenograft histology
Hematoxylin and eosin (H&E) staining of control and POU2F3-OE subcutaneous tumors. H&E adds histological context to the tumor-weight readout.
DCheck whether the marker program persists in vivo
Multiplex immunofluorescence staining of xenograft sections for DAPI, CGA, POU2F3, SOX9, and DCLK1; each channel is shown separately and merged for the control and POU2F3-OE groups. POU2F3, tuft-associated markers and CGA connect the in vivo tumors to the state validation performed in culture.
EInspect heterogeneity in patient tissue
Multiplex immunofluorescence staining of a GTN patient tumor section (P18) for DAPI, CGA, and POU2F3; representative regions highlight POU2F3-high and POU2F3-low tumor cells. High and low regions within the tissue caution against treating the tumor as a uniform POU2F3 state.
FIdentify corresponding combinations in blood
Immunofluorescence images of CTCs isolated from GTN patient blood (P18) stained for DAPI, POU2F3, CGA, DCLK1, SOX9, and CD45; examples of POU2F3-high/CGA-low and POU2F3-low/CGA-high CTCs are shown. Compare POU2F3/CGA combinations while using the CD45 channel to distinguish the leukocyte background.
GCompare the blood readout across disease groups
Quantification of the fraction of CGA-low/POU2F3-high CTCs in hydatidiform mole (HM) and GTN samples. ****, P < 0.0001. The group difference supports disease association rather than establishing a diagnostic cutoff or predictive performance.
Takeaway
Paired animal experiments, tissue markers and blood comparisons place the Figure 3 findings in disease-related settings. POU2F3 is not the only GTN state; Figure 5 next examines the functionally distinct BHLHE41/senescent-like branch.
BHLHE41 overexpression promotes senescence induction and the fraction of BHLHE41+ CTCs is correlated with GTN progression
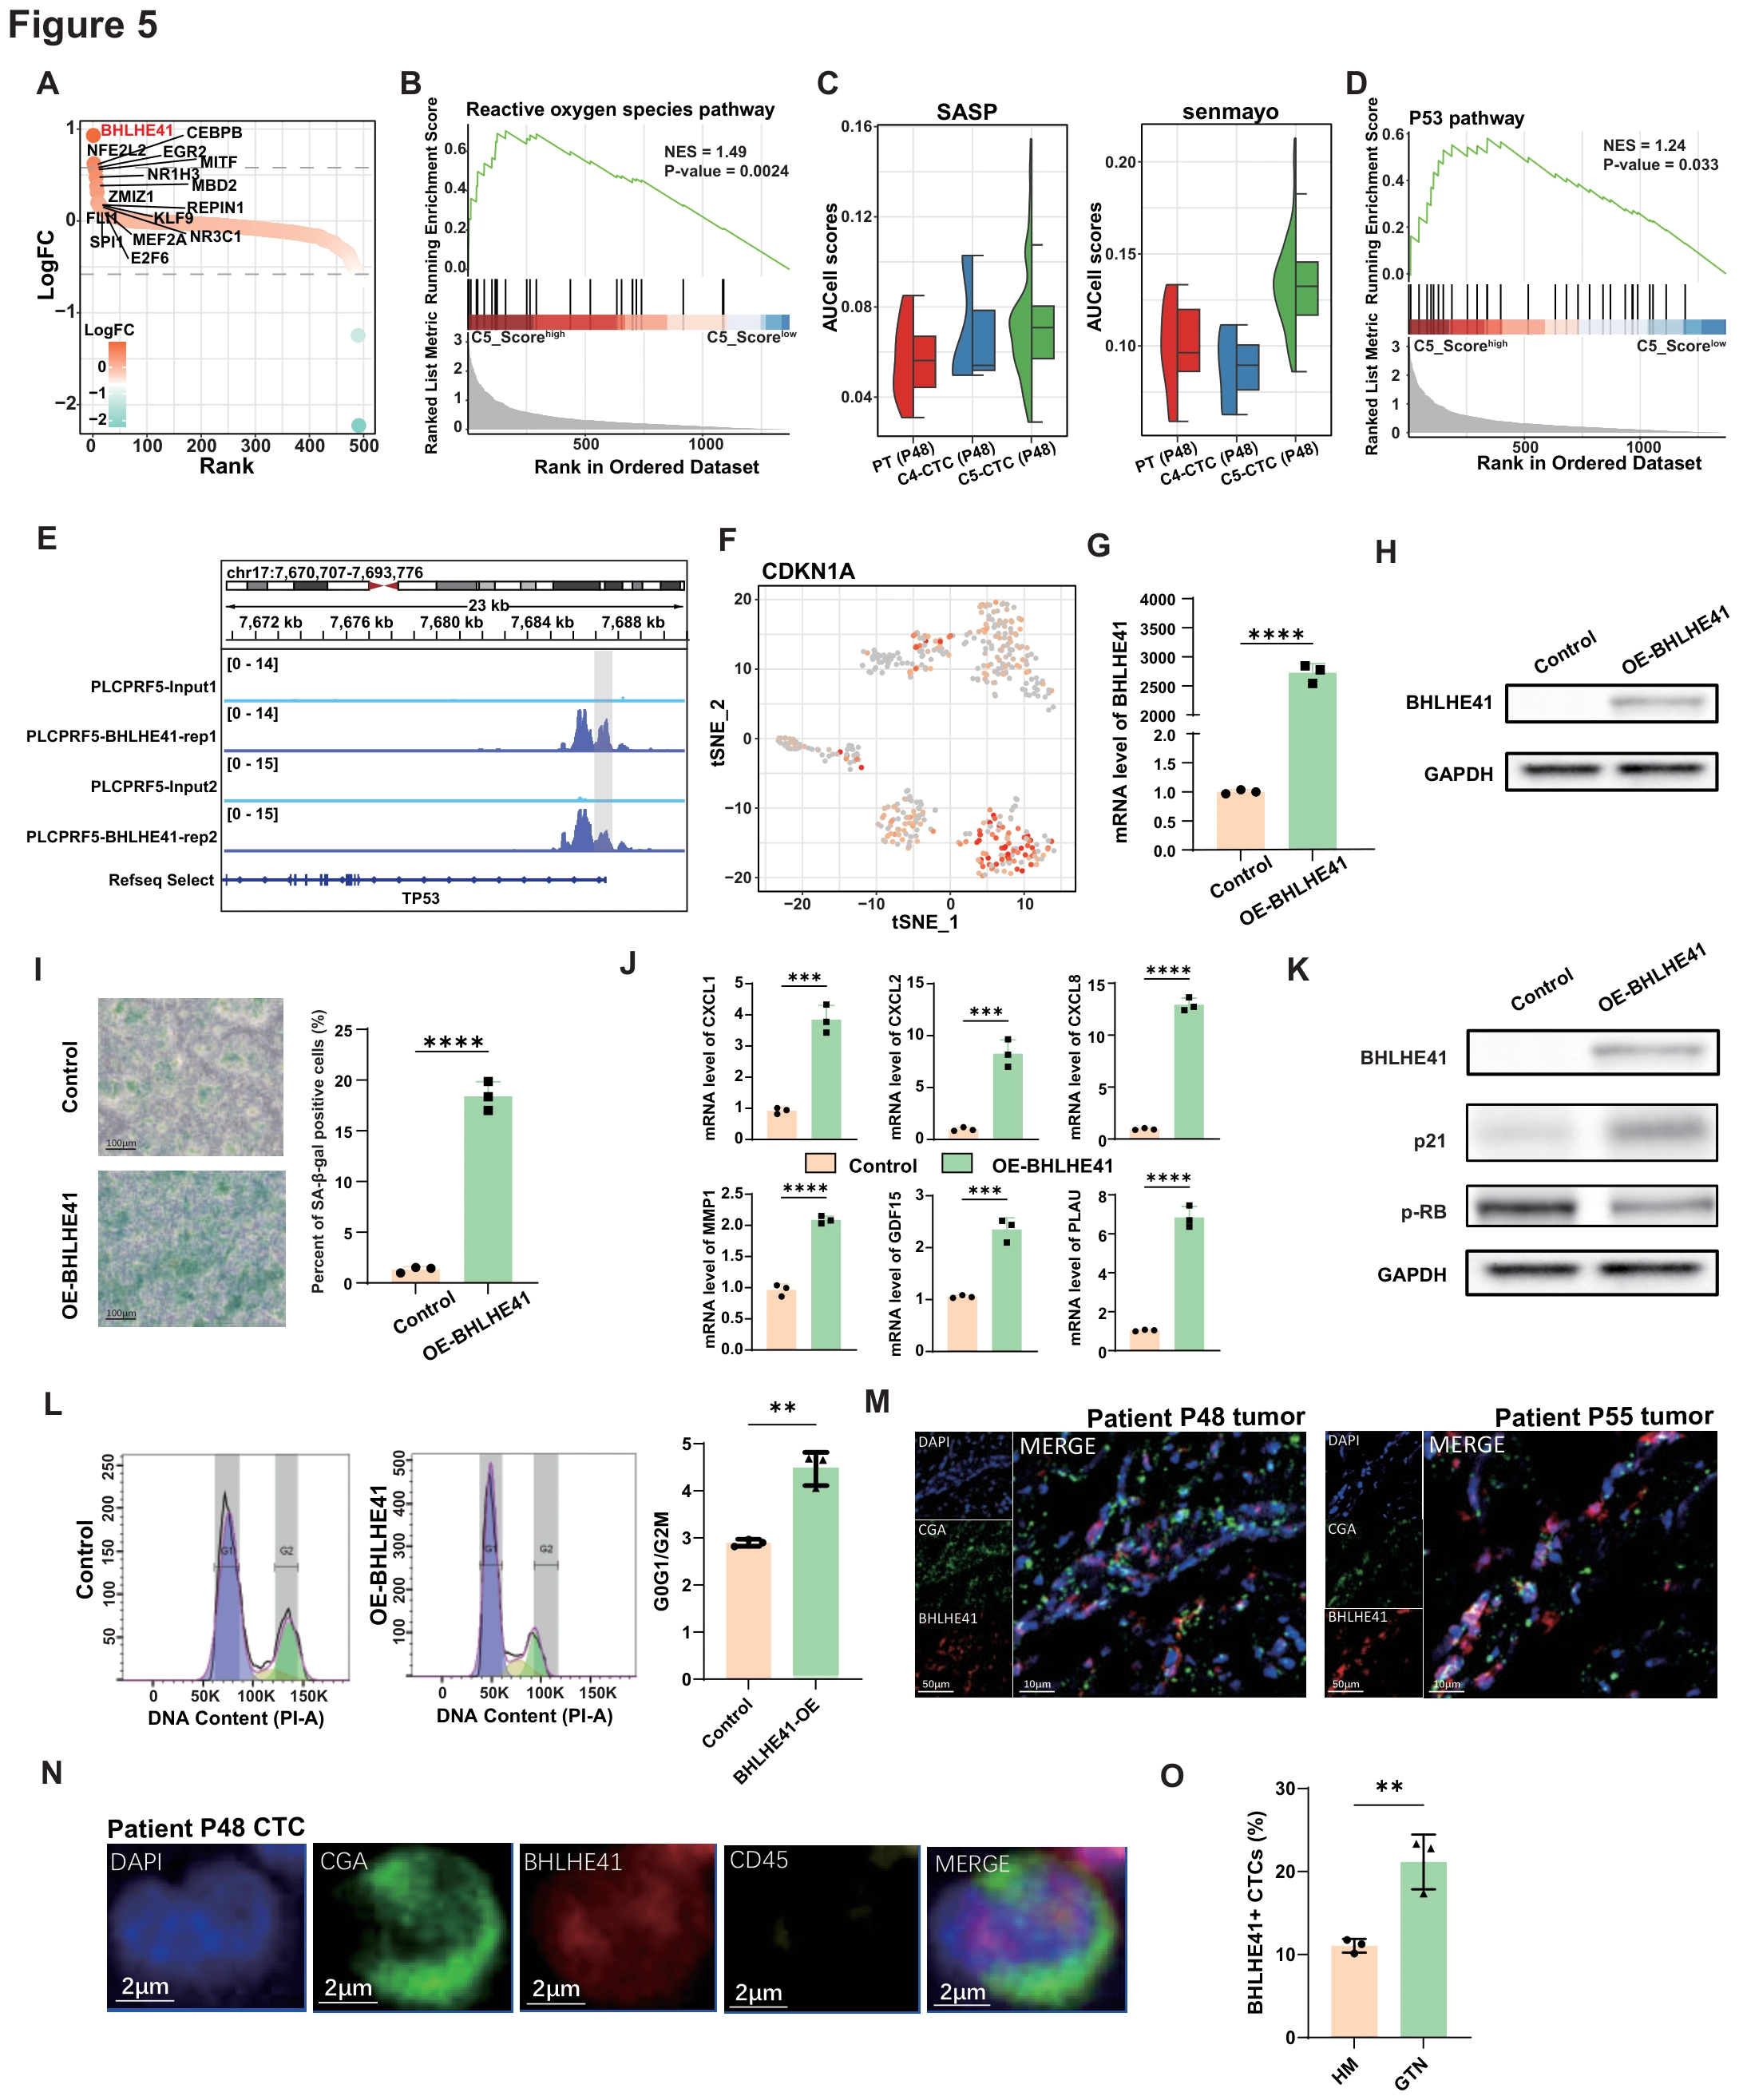
This figure develops the BHLHE41-associated branch, distinct from the tuft-like state. A–F nominate transcriptional and senescence-related features, G–L test function through overexpression, staining and cell-cycle measurements, and M–O examine patient tissue and blood.
ALocate the BHLHE41-associated regulatory state
The dot plot shows the specific expression TFs of the C5_BHLHE41 subcluster. The transcription-factor profile motivates selection of BHLHE41 for perturbation.
BInspect the ROS-associated program
The enrichment of the reactive oxygen species (ROS) pathway in C5_BHLHE41 subcluster. The pathway clue is interpreted with the subsequent senescence readouts rather than defining senescence by ROS enrichment alone.
CCompare senescence-associated gene sets
Single-sample gene set enrichment analysis (ssGSEA) of the SASP and Senmayo pathway in different subclusters of P3 patient. SASP and Senmayo examine the candidate state through different gene-set definitions.
DNominate a p53-associated mechanism
The enrichment of the P53 pathway in C5_BHLHE41 subcluster. This moves from a state description toward a regulatory pathway related to cell-cycle behavior.
EInspect binding evidence at TP53
IGV software was used to visualize BHLHE41 binding site in the promoter of TP53. BHLHE41 ChIP-seq confirmed motif binding site prediction analysis. Binding data connect the candidate factor to the p53 pathway alongside the downstream experiments.
FLocate downstream CDKN1A expression
The t-SNE plot shows the expression of CDKN1A. This places the p53/p21-related clue within the single-cell population context.
GValidate overexpression at RNA level
The mRNA levels of BHLHE41 in Vector and OE-BHLHE41 group of GTN cell line. ****, P < 0.0001. The perturbation must be established before interpreting downstream senescence-associated phenotypes.
HConfirm the BHLHE41 protein response
The protein levels of BHLHE41 in Vector and OE-BHLHE41 group of GTN cell line. Protein measurement adds a second level of perturbation validation to G.
IInspect SA-β-gal staining
Results of the SA-β-gal staining experiment in the group of Vector and OE- BHLHE41. This is one senescence-associated observation, interpreted together with molecular and cycle readouts in J–L.
JInspect secretory-phenotype-associated genes
Histogram of the RNA levels of senescence-related genes (including CXCL1, CXCL2, CXCL8, PLAU, GDF15, and MMP1) in Vector and OE-BHLHE41 group of GTN cell line. This asks whether SASP-associated expression accompanies the staining change.
KAdd senescence-associated protein evidence
Western blot analysis of p-RB, Laminb1, and p21 in Vector and OE-BHLHE41 group of GTN cell line. The protein measurements provide complementary readouts of the cell-state change.
LExamine cell-cycle distribution
Results of the G0/G1 cycle in Vector and OE-BHLHE41 group of GTN cell line. The cycle readout links molecular markers to proliferative state without establishing irreversibility from a single time point.
MReturn to patient tissue
Multiplex immunofluorescence staining of GTN patient tumor sections (P3 and P6) for DAPI, CGA, and BHLHE41. Patient staining checks whether markers followed in the cell model are also observable in clinical material.
NCheck the marker in blood CTCs
mIF staining of patient-derived CTCs showing BHLHE41 (red) and CGA (green) in DAPI⁺/CD45⁻ cells. DAPI, CGA and CD45 establish cellular context before interpreting BHLHE41 positivity.
OTest the HM–GTN difference
Quantification of BHLHE41⁺ CTCs in patients with hydatidiform mole (HM) and gestational trophoblastic neoplasia (GTN); **P < 0.01. Parallel to the POU2F3 branch in Figure 4, this compares the disease association of another candidate CTC state.
Takeaway
The BHLHE41 branch is assessed through multiple senescence-associated readouts rather than one stain, then connected to clinical CTC observations. Figure 6 integrates the cilia-like, tuft-like and senescent-like branches into a model of GTN cellular heterogeneity.
Working model
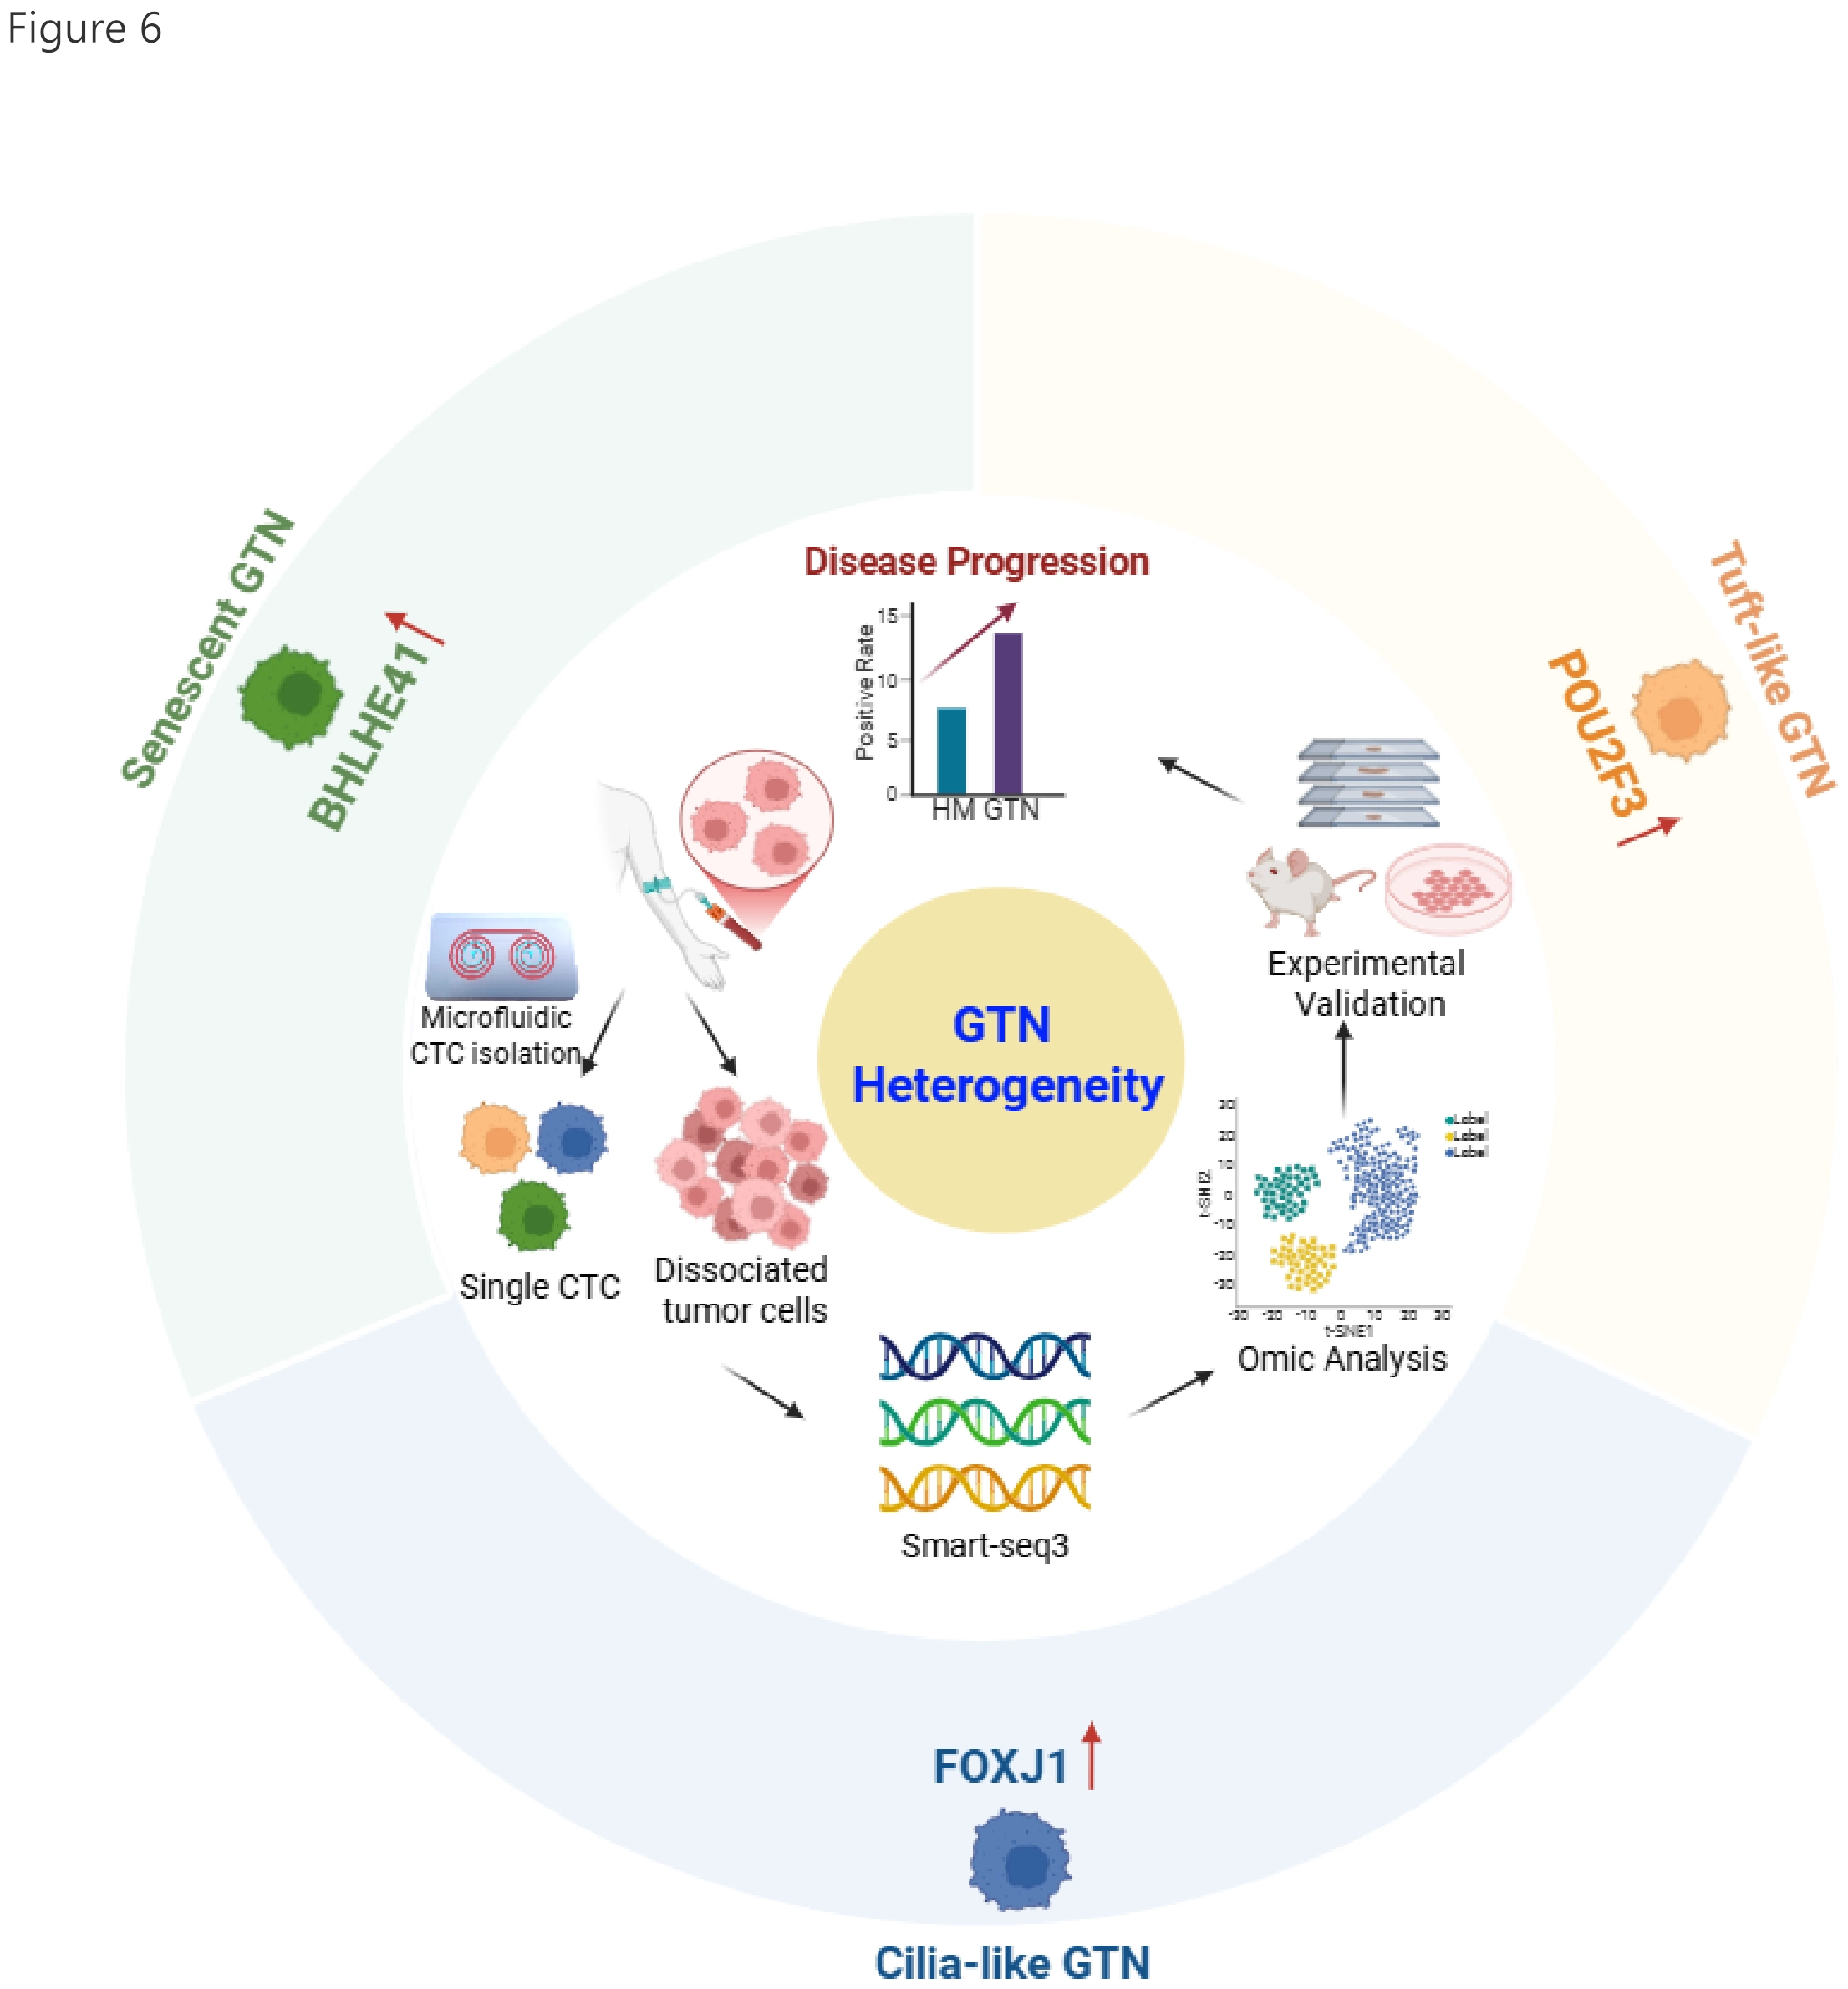
The final model connects Figures 1–5: blood and tissue profiling establish heterogeneity, distinct GTN states are identified and investigated, and their relevance is revisited in patient samples. It links sampling, subtyping, functional testing and clinical observation rather than adding another result.
Working model. The plot shows the working model of this study. We collected peripheral blood and tumor tissue samples from GTN patients. Single circulating tumor cells (CTCs) were isolated from blood using a microfluidic platform, and single tumor cells were obtained from dissociated tumor tissues. We then performed SMART-seq3 on single cells and conducted multi-omics analyses to characterize GTN heterogeneity, identifying three CTC subtypes: tuft-like (POU2F3 upregulated), cilia-like (FOXJ1 upregulated), and senescent-like (BHLHE41 upregulated), with these transcription factors serving as subtype-defining drivers. We further validated these findings through mIHC/mIF staining, in vitro functional assays in GTN cell lines, and in vivo animal models. Finally, we examined whether the abundance of these CTC subtypes was associated with disease progression in clinical samples to evaluate their translational potential as noninvasive biomarkers of disease progression and therapeutic response.
Takeaway
The figure set separates three questions: which CTC state is detected, how it may function, and how it relates to disease groups. Their combination motivates translational investigation without constituting a clinically validated subtyping test.
My contribution
My work spanned clinical sample processing, microfluidic isolation, mIF staining, manual single-cell isolation, SMART-seq3 library preparation, genetically modified cell lines and in vitro and in vivo functional studies. I also drafted the majority of the manuscript and created most of its figure panels.
Outcomes & record
The related manuscript, “Circulating Tumor Cell-Based Molecular Classification Reveals Heterogenous Subclones in Gestational Trophoblastic Neoplasia,” was submitted to Genome Medicine and is under review. I am a co-first author.