Biomed / 06
Single-cell landscape of hepatoid ovarian carcinoma
Profiles 21,243 cells from one case of hepatoid ovarian carcinoma to examine malignant epithelial states, FGFR4-associated clonal changes and lipid metabolism, with tissue staining and in vitro validation. I contributed experimental and manuscript work as a co-first author. The manuscript is under review.
- Publication status
- Under review
- Submitted to
- Journal of Ovarian Research
- Authorship
Abstract
Hepatoid carcinoma of the ovary (HCO) is a rare and aggressive ovarian malignancy with limited molecular characterization. We performed single-cell RNA sequencing on tumor tissue from an HCO patient to delineate its cellular composition, clonal evolution, and potential therapeutic targets. Malignant epithelial cells exhibited hepatocellular carcinoma-like transcriptional features and extensive copy-number variations. Clonal analysis identified FGFR4 upregulation in a late-evolving epithelial subclone, which was further supported by drug-response prediction and multiplex immunohistochemistry.
Trajectory analysis revealed a transition toward an APOA1-positive subtype with enhanced fatty acid metabolism. Additionally, elevated GDF15 expression in this subtype was associated with poor prognosis and predicted macrophage interaction. These findings provide single-cell-level insights into HCO pathogenesis and therapeutic vulnerability.
Figures
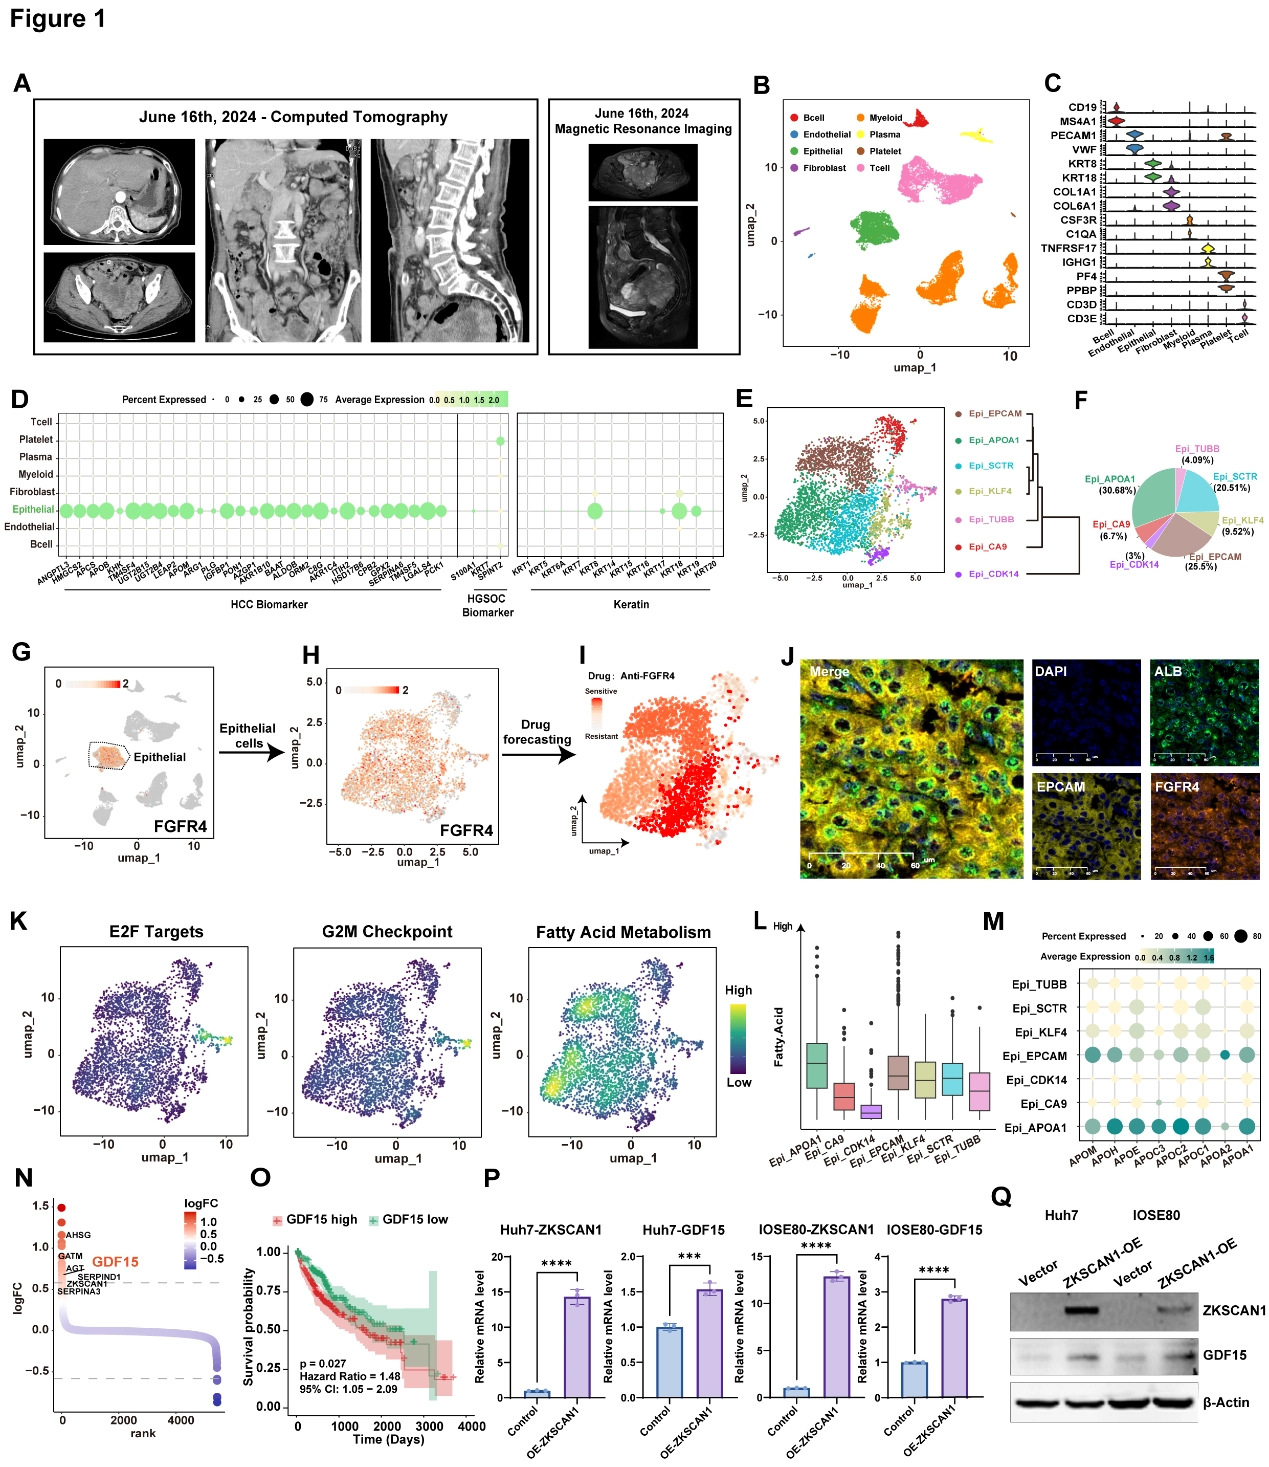
Single-cell transcriptomic analysis of hepatocellular carcinoma of the ovary (HCO)
This case study concentrates several layers into one main figure. A–F establish the case and cellular composition, G–J focus on FGFR4 expression, prediction and tissue validation, and K–Q follow the APOA1-associated metabolic state toward the candidate GDF15–ZKSCAN1 relationship.
AEstablish the imaging context
Computed tomography and magnetic imaging of the patient in this case. This is the clinical context of the profiled case, not independent molecular-mechanism evidence.
BMap the tumor's cellular composition
Uniform manifold approximation and projection (UMAP) plot of all single cells from the HCO patient. Cell clusters were annotated based on canonical marker genes. Distinguishing epithelial, immune and stromal compartments enables subsequent molecular localization.
CCheck annotations with marker genes
Violin plot showing genes highly expressed in each subpopulation presented in Figure 1B. Read with B to understand the basis for each cell-identity label.
DCompare liver-like and ovarian-cancer programs
Bubble heatmap showing the expression levels of HCC biomarker, HGSOC biomarker and keratin of different cell clusters. The HCC, HGSOC and keratin programs supply reference points for interpreting HCO transcriptional features.
EResolve epithelial states
UMAP plot showing 7 cell subpopulations of the epithelial cells (left panel) and hierarchical clustering of these subpopulations (right panel). The analysis moves from overall composition to heterogeneity within the epithelial compartment.
FQuantify the epithelial-state composition
Pie chart illustrating the relative proportions of epithelial cell subpopulations. The proportions establish the relative representation of the states examined later in this case.
GLocate FGFR4 across all cells
UMAP plot showing the expression level of FGFR4 in all cell clusters in Figure 1B. This first identifies the expressing compartment rather than inferring target location from bulk abundance.
HResolve FGFR4 within epithelium
UMAP plot showing the expression level of FGFR4 specifically in epithelial cell subtype. Compared with G, this asks whether expression is concentrated in particular epithelial states.
IGenerate a drug-response hypothesis
UMAP visualization of drug-forecasting of applying anti-FGFR4 treatment on epithelial cell subtype. Each point represents an individual cell, with the color gradient indicating predicted sensitivity to FGFR4 inhibition. This is a computational hypothesis for intervention, not an observed response to treatment.
JValidate expression localization in tissue
Multiplexed immunohistochemistry (mIHC) of HCO tissue stained for FGFR4 (orange), EPCAM (yellow), ALB (green), and DAPI (nuclei; blue). Scale bar, 60 μm. Co-staining with EPCAM and ALB checks cellular context, not the predicted efficacy in I.
KCompare proliferation and metabolic programs
Density of the E2F Target, G2M Checkpoint and Fatty Acid Metabolism scores of epithelial cell subtype. Placing proliferation and fatty-acid programs side by side helps distinguish the functional emphases of epithelial states.
LExamine the fatty-acid-associated comparison
Comparison of Fatty Acid expression levels in the 7 epithelial cell subpopulations. This adds another state-resolved view of the metabolic feature examined in K.
MInspect apolipoprotein genes
Dot plot showing apolipoprotein related genes for each subpopulation of epithelial cell. Dot size indicates the fraction of expressing cells and the colors represent normalized gene expression levels. Individual genes complement aggregate metabolic scores and clarify the APOA1-associated state.
NNominate molecules associated with the metabolic state
Differentially expressed genes between Epi_APOA1 and the other epithelial cell subpopulations. Differential expression moves from state description to candidates for subsequent validation.
ORetain the scope of the outcome association
Kaplan- Meier estimation of survival time of HCO patients based on the score of GDF15. Source discrepancy: this legend says HCO patients, while the manuscript Results names TCGA-LIHC. This panel is therefore not presented as independent HCO-cohort validation. The result must retain its stated source context rather than being taken as validation in an independent HCO cohort.
PTest the candidate regulator's transcript effect
Relative mRNA levels of ZKSCAN1 and GDF15 in vector control and ZKSCAN1-overexpressing (OE-ZKSCAN1) Huh7 and IOSE80 cells. ***, ***, P < 0.001; ****, P < 0.0001. Increasing ZKSCAN1 and measuring GDF15 advances the association into a perturbation test in cell models.
QRecheck the relationship at protein level
Protein levels of ZKSCAN1 and GDF15 in vector control and ZKSCAN1-overexpressing Huh7 and IOSE-80 cells. Paired with P, this examines the candidate regulatory relationship at RNA and protein levels.
Takeaway
The atlas generates two avenues for further study: potential FGFR4-related vulnerability and the connection between metabolic state and ZKSCAN1/GDF15. Localization, drug prediction, tissue staining and cell-line perturbation answer different questions; together they motivate investigation rather than establishing treatment response in this case or an HCO population.
My contribution
As a co-first author, I contributed in vitro experiments, drafted manuscript sections and revised the full text. My experimental work included stable GDF15-overexpressing cell-line generation and assistance with ChIP-qPCR.
Outcomes & record
The study provides a single-cell landscape of HCO and identifies FGFR4-associated clonal changes and lipid-metabolic reprogramming. The potential value of FGFR4 inhibition is supported by model predictions and expression evidence and requires further functional and clinical investigation.
The related manuscript, “Single-cell transcriptomic profiling reveals FGFR4-driven clonal evolution in a case of hepatoid carcinoma of the ovary,” was submitted to Journal of Ovarian Research and is under review. I am a co-first author.