Biomed / 03
Cell fusion & breast cancer metastasis
Contributed to single-cell isolation and SMART-seq3 library preparation, fusion-cell culture, orthotopic CDX models, in vivo imaging and tissue processing. The related paper was published in Cancer Research.
- Publication status
- Published
- Journal
- Cancer Research
Abstract
Intratumoral heterogeneity supports cancer progression and metastasis while limiting therapeutic efficacy. Comprehensive biological characterization of heterogeneous subclones in breast cancer may hold promise in battling against this deadly disease. Using single-cell transcriptomic analysis and in situ profiling of primary tumors, metastases, and circulating tumor cells from multiple patients with breast cancer, we identified a unique EPCAM+ CD68+ TREM2+ tumor subpopulation, likely resulting from the fusion of tumor cells and lipid-associated macrophages (LAM).
The presence of these tumor-LAM fusion cells in the blood or in distinct metastatic sites was significantly correlated with metastatic progression. Stable fusion clonal lines established in vitro exhibited substantially enhanced proliferation, tumor initiation, and metastasis formation in mice. Integrative molecular and functional analyses revealed a critical role for SNX10 in mediating tumor-LAM fusion. Mechanistically, SNX10 physically interacted with the phospholipid scramblase ANO6 and maintained its protein stability by suppressing proteasome-mediated degradation.
Furthermore, the transcription factor CBX3 directly targeted SNX10 promoter and modulated its expression. Fusion cells accumulated abundant intracellular lipid droplets and were highly sensitive to simvastatin treatment in vitro and in vivo. Together, this study uncovered that CBX3-SNX10-ANO6 signaling facilitates generation of an aggressive tumor-LAM fusion cell subpopulation that promotes metastasis, revealing an alternative metastatic mechanism and exposing putative therapeutic vulnerabilities.
Read paper ↗Figures
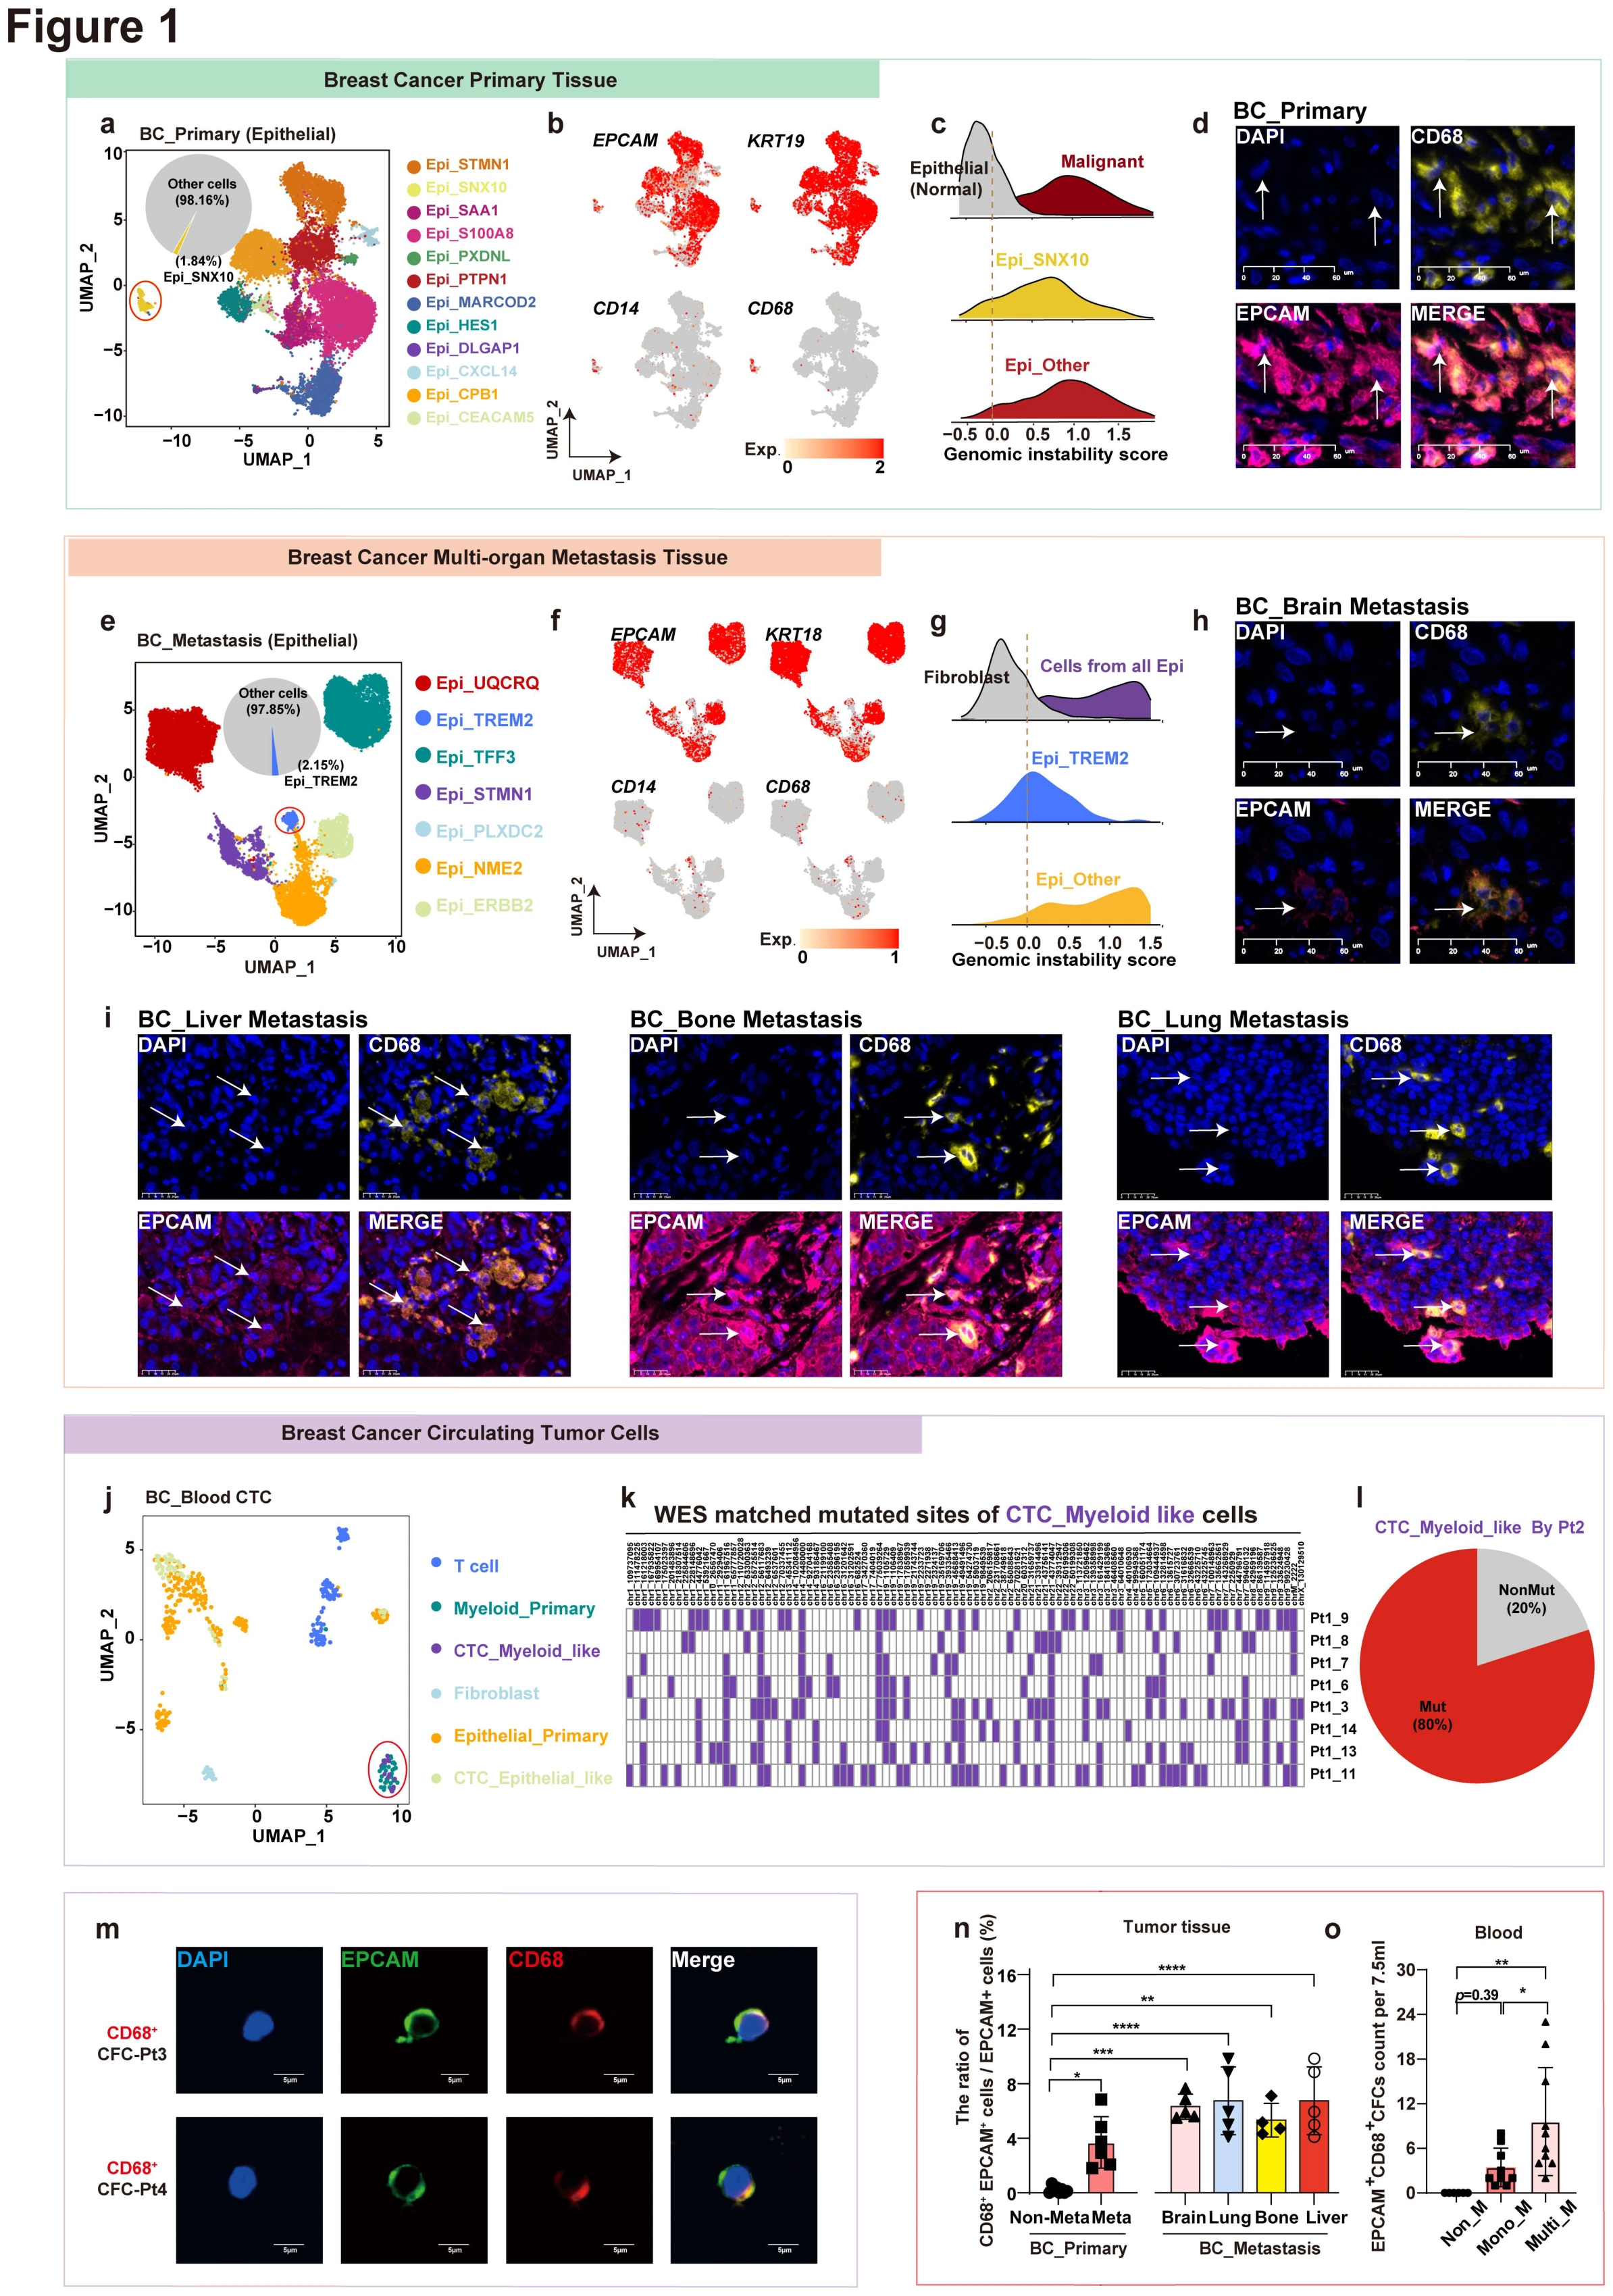
Single-cell analysis reveals myeloid-like tumor fusion cells across primary, metastasis, circulating tumor cells (CTCs) in breast cancer
The study begins with a cell-identity question: are there tumor cells bearing both epithelial and myeloid features in breast cancer? Panels a–i examine primary and metastatic tissue, j–m extend the analysis to blood and mutation matching, and n–o compare the candidate cells across metastatic settings.
aMap primary-tumor epithelial states
The Uniform Manifold Approximation and Projection (UMAP) showing epithelial cell subpopulations in primary breast cancer. Each dot indicates a single cell. Color‐coded for clusters. These epithelial populations provide the comparison framework for the identity question.
bInspect epithelial and myeloid marker patterns
The UMAP showing the EPCAM, KRT19, CD14, and CD68 expression in epithelial cells of primary breast cancer. The marker combination raises a mixed-identity hypothesis that needs tissue and genomic evidence.
cAdd genomic-instability context
Ridgeline plot showing the genomic instability score of SNX10+ malignant cells and other malignant cells in primary breast cancer. This asks whether the candidate population has tumor-associated features beyond myeloid-marker expression.
dInspect double-positive cells in primary tissue
Multiplex immunohistochemistry was performed for DAPI (blue), EPCAM (pink) and CD68 (yellow) in primary breast cancer; each stain was shown separately and merged. The circles represent the EPCAM+ CD68+ cells. Scale bars, 20μm. Tissue staining checks whether the single-cell expression clue has an in situ counterpart.
eExtend the atlas to metastatic sites
The UMAP plot of epithelial cell subpopulations in breast cancer brain and liver metastases. Each dot indicates a single cell. Color‐coded for clusters. A metastatic-site atlas tests whether the observation is confined to primary tumors.
fRecheck markers in metastatic populations
The UMAP plot showing the EPCAM, KRT19, CD14, and CD68 expression in epithelial cells of breast cancer brain and liver metastases. Using the marker combination from b enables comparison of the related states across sites.
gCheck genomic context in the metastatic candidate
Ridgeline plot showing the genomic instability score TREM2+ malignant cells and other malignant cells subtypes in breast cancer brain and liver metastases. Parallel to c, this adds malignancy-associated context for the candidate state in metastases.
h-iInspect the correspondence across metastatic organs
Multiplex immunohistochemistry was performed for DAPI (blue), EPCAM (pink) and CD68 (yellow) in breast cancer brain metastases (h), liver metastasis, bone metastasis and lung metastasis (i); each stain was shown separately and merged. The arrow represent the EPCAM+ CD68+ cells. Scale bars, 20μm. Staining across organs extends the tissue context beyond a single lesion.
jLook for a corresponding state in blood
The UMAP plot showing two distinct CTCs (epithelial-like CTCs and myeloid-like CTCs), as defined by subpopulations in Figure S 1g. This brings the tissue-identity question into CTCs and motivates the circulating-fusion-cell investigation.
kCheck origin through mutation matching
Heatmap showing the matched WES (whole exon sequence) sites in C2 CTCs in Pt2. Matched genomic sites provide evidence independent of expression-based identity.
lQuantify the mutation-matched fraction
Pie chart showing the proportion of genomic mutation matched C2 CTCs in Pt2. This quantifies how much of the candidate population is supported by the matching in k.
mRecheck both markers in blood cells
Immunofluorescence was performed for DAPI (blue), EPCAM (green) and CD68 (red) in CTCs isolated from Pt3 and Pt4; each stain was shown separately and merged. Cell imaging complements transcript and mutation analyses by checking the EPCAM/CD68 combination.
nCompare candidate-cell fractions in tissue
Comparison of the proportion of CD68+ EPCAM+ / EPCAM+ cells in BRCA patients without metastatic (n=8), primary foci of metastatic BRCA patients (n=6), brain metastasis (n=5), lung metastasis (n=5), bone metastasis (n=4) and liver metastasis (n=6). * p < 0.05, ** p < 0.01, *** p < 0.001, **** p < 0.0001, one-way ANOVA with Dunnett’s post test. Quantification across sites and clinical groups examines the association with metastatic settings.
oRelate circulating-cell counts to metastatic extent
Comparison of the number of the EPCAM+ CD68+ CFCs in BRCA patients without metastasis (n=6), with a single detectable metastatic site (Mono_M, n=9) and multiple detectable metastatic sites (Multi_M, n=10). Data are presented as the mean ± SD. * p < 0.05, ** p < 0.01, one-way ANOVA with Turkey’s post test. The groups compare existing metastatic extent rather than prospectively predicting future metastasis.
Takeaway
This establishes the candidate myeloid-like tumor population and its tissue and blood correspondence. Marker coexpression alone does not prove a fusion origin: Figure 2 narrows the macrophage candidate, and Figure 3 then uses traceable co-culture and biparental validation.
Breast cancer cells could fuse with lipid-associated macrophages
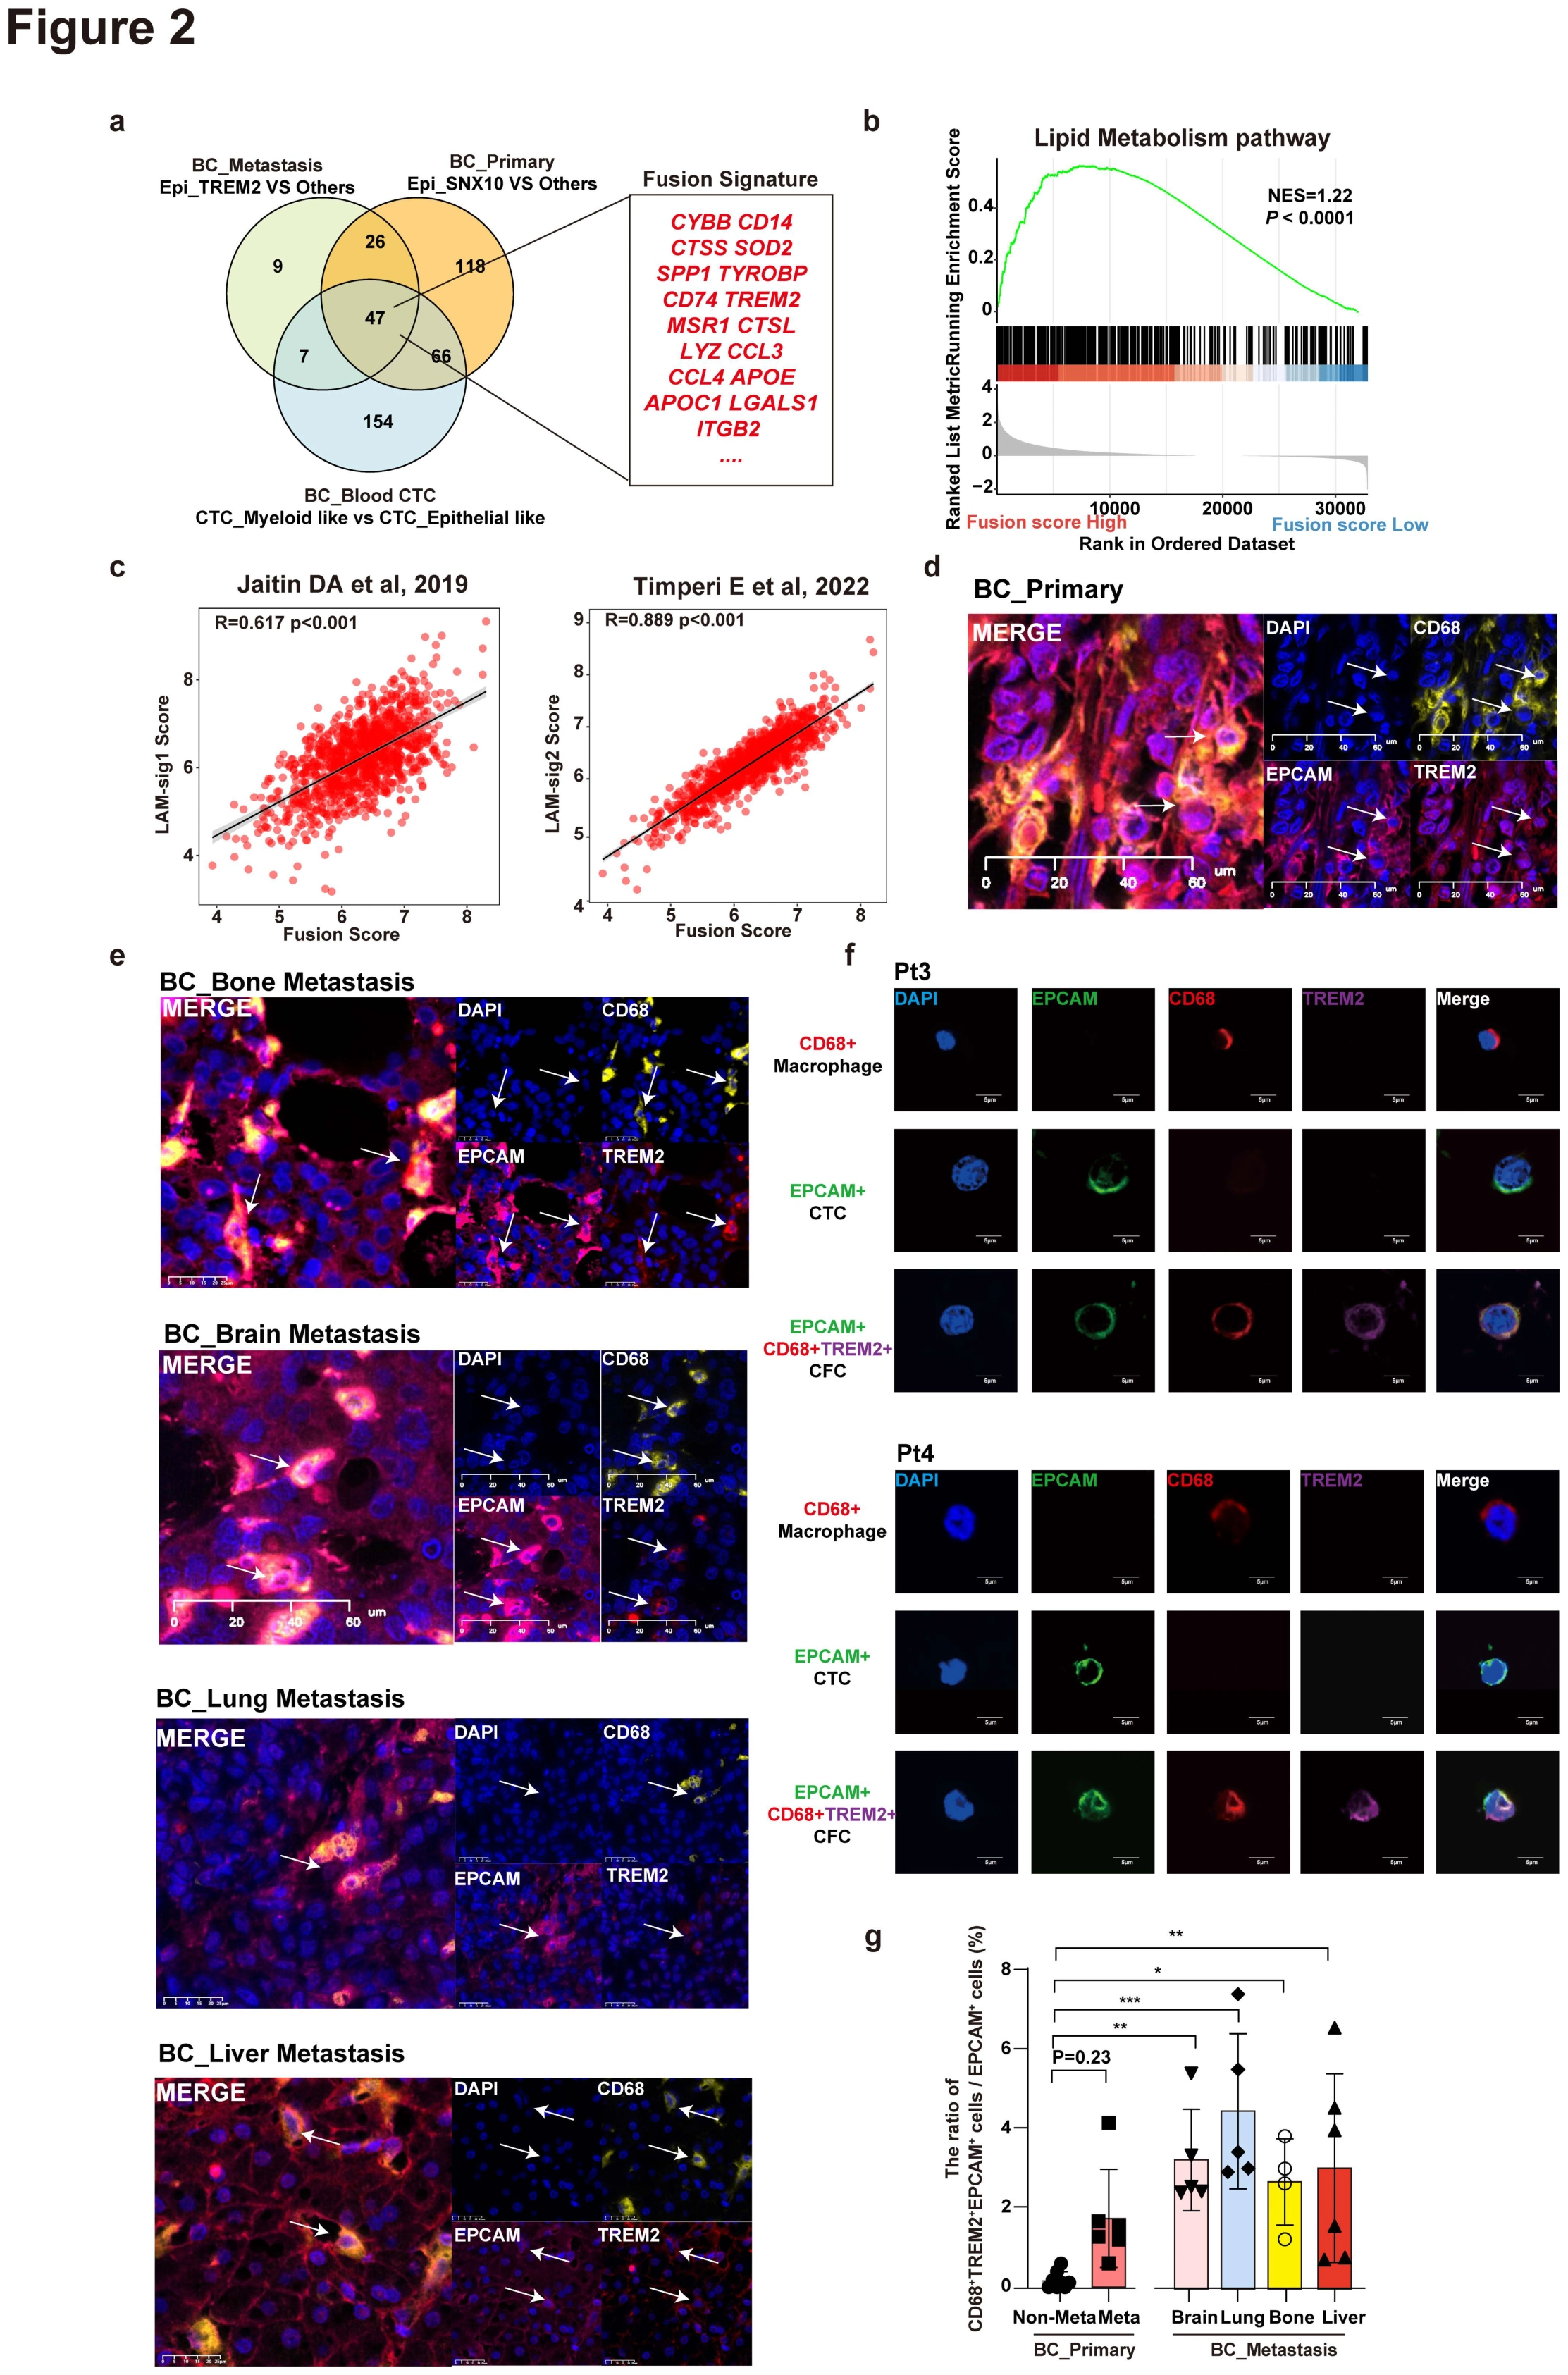
After observing mixed epithelial/myeloid features, the study asks whether the candidate myeloid partner has LAM characteristics. Panels a–c connect shared expression and lipid metabolism with LAM signatures; d–g examine EPCAM, CD68 and TREM2 together in tissue, blood and group comparisons.
aDefine a shared signature across populations
Venn diagram showing the overlap of genes with high expression in Epi_TREM2, Epi_SNX10, and CTC_Myeloid_like subpopulations based on differentially expressed gene (DEG) analysis (logFC > 0.58 and p < 0.05). The overlap genes were defined as a fusion signature. P values in a were calculated using a two-sided paired Wilcoxon signed-rank test. Shared genes connect the candidate states found in primary tumors, metastases and CTCs.
bInspect the lipid-metabolism program
Gene set enrichment analysis (GSEA) showing that the lipid metabolism pathway was overrepresented in high fusion score groups. Enrichment motivates investigation of lipid-associated macrophages as a candidate contributor.
cRelate LAM and candidate fusion signatures
Scatter plot showing the correlation between LAM signature scores and fusion score in TCGA‐BRCA. The fusion score was calculated using MCP_counter with fusion signature in a. The LAM signature scores were calculated using MCP_counter with LAM signatures. P values were calculated by Spearman correlation tests. The correlation tests co-occurrence of the signatures, not the occurrence of a fusion event.
d-eInspect the three-marker combination in tissue
Multiplex immunohistochemistry was performed for DAPI (blue), EPCAM (pink), CD68 (yellow) and TREM2 (red) in primary breast cancer (d) and breast cancer brain metastases, liver metastasis, bone metastasis and lung metastasis (e). Each stain was shown separately and merged. The circles represent the EPCAM+ CD68+ TREM2+ cells. Scale bars, 20μm. Adding TREM2 narrows the tissue observation toward a LAM-associated state.
fCheck the same combination in blood
Immunofluorescence was performed for DAPI (blue), EPCAM (green), CD68 (red) and TREM2 (purple) in CTCs isolated from Pt3 (left) and Pt4 (right). Matching tissue markers connects the candidate-cell features to the circulating compartment.
gQuantify triple-positive fractions across groups
Comparison of the proportion of CD68+ TREM2+ EPCAM+ / EPCAM+ cells in BRCA patients without metastatic (n=8), primary foci of metastatic BRCA patients (n=6), brain metastasis (n=5), lung metastasis (n=5), bone metastasis (n=4) and liver metastasis (n=6). * p < 0.05, ** p < 0.01, *** p < 0.001, **** p < 0.0001, one-way ANOVA with Dunnett’s post test. Group-level quantification complements the representative observations in d–f.
Takeaway
The candidate partner is narrowed from myeloid cells broadly to lipid-associated macrophages, primarily through clinical feature correspondence. Figure 3 then establishes LAM–tumor co-culture and tests for stable clones with evidence from both parents.
The establishment of tumor-LAM fusion clones displaying bi-parental origins
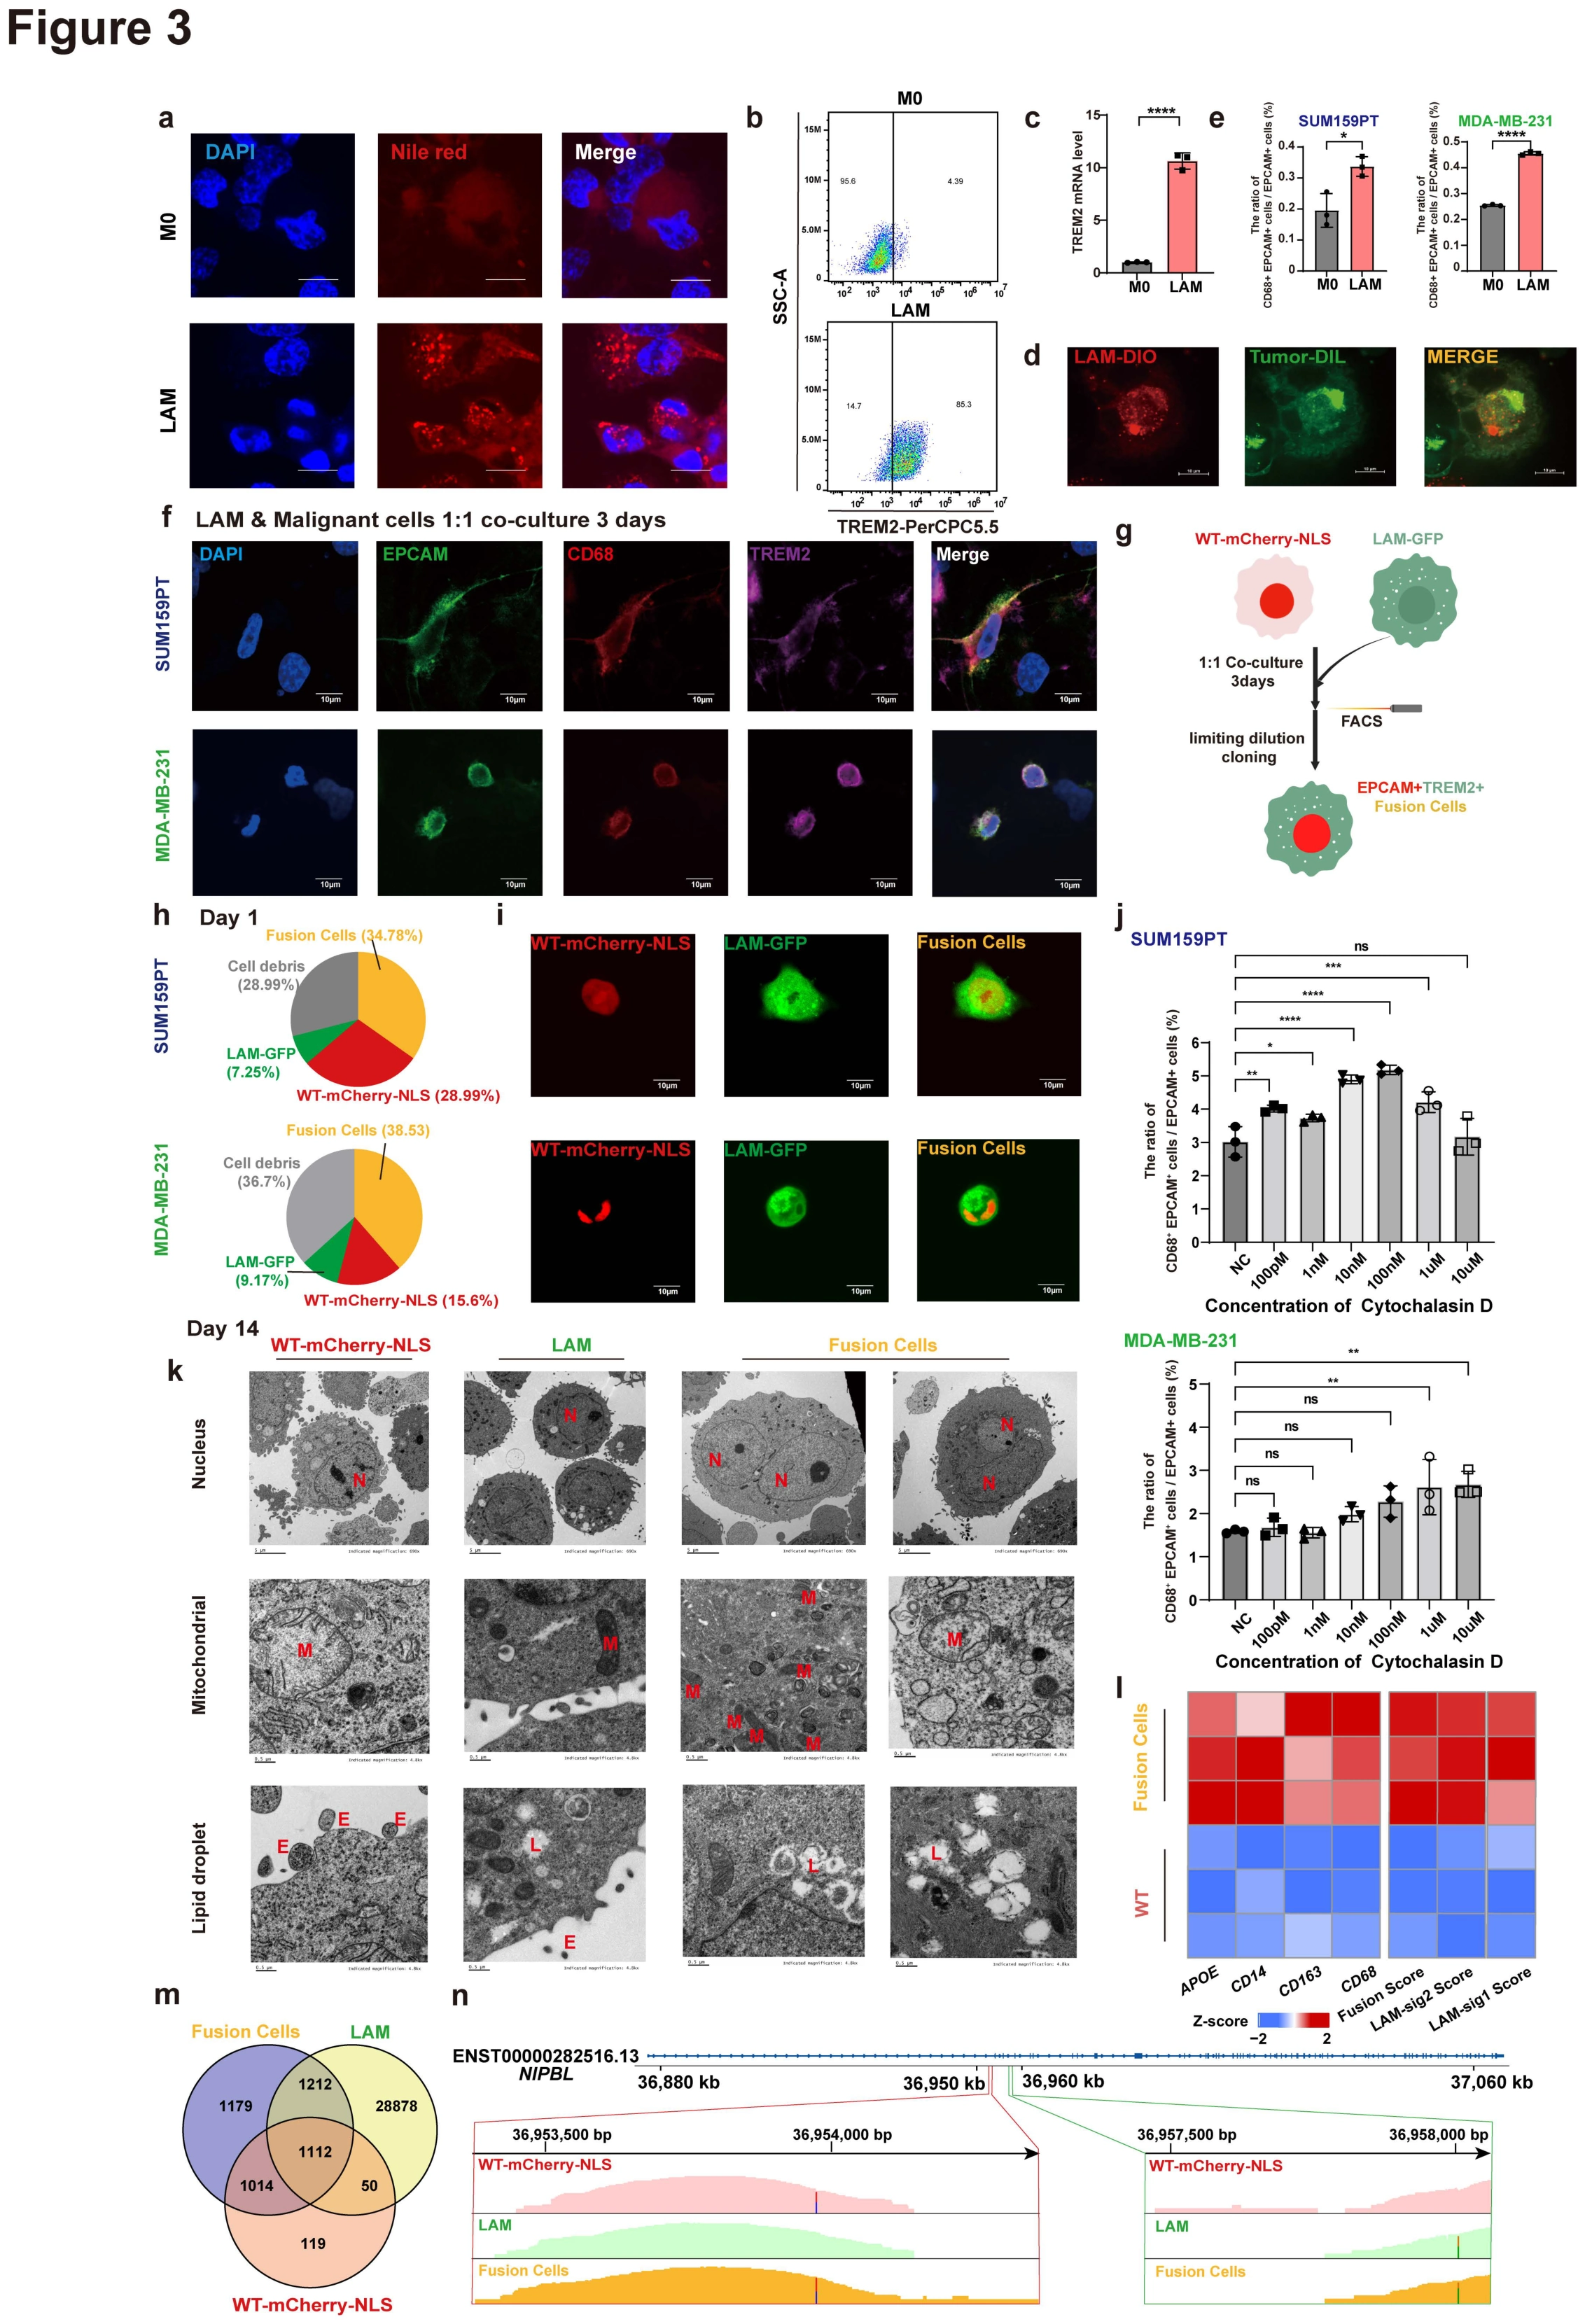
A fusion interpretation requires a traceable experimental system beyond mixed markers. This figure first characterizes LAMs and examines candidate events in co-culture, then uses sorting, imaging, transcriptional and genomic analyses to investigate biparental origins of the resulting clones.
aCharacterize the LAM lipid phenotype
Immunofluorescence staining was performed for DAPI (blue), Nile red (red) in M0 and LAM; each stain was shown separately and merged. Scale bars, 10μm. The partner's lipid phenotype is checked before treating it as a LAM population.
bMeasure the LAM-associated protein marker
Flow cytometry analysis of M0 and LAM (TREM2). Flow cytometry adds a state readout distinct from lipid staining.
cAdd transcript-level TREM2 validation
The mRNA levels of TREM2 in M0 and LAM. Together with a–b, this characterizes the M0/LAM models used in the subsequent comparisons.
dInspect candidate cells after co-culture
Confocal images of fusion cells that healthy human-derived monocytes induced LAM and MDA-MB-231 after 3 days co-culture. Scale bars, 10μm. Confocal observations form one component of the evidence, complemented by sorting and biparental analyses.
eCompare M0 and LAM partners
The ratio of fusion cells / malignant cells between SUM159PT or MDA-MB-231 co-culture with healthy human-derived M0 or LAM. The ratio of fusion cells / malignant cells = (FITC+ APC+) / FITC+. Pairing the same tumor cells with different macrophage states tests the relevance of the LAM condition.
fCheck the post-co-culture marker combination
Immunofluorescence staining was performed for DAPI (blue), CD68 (red), EPCAM (green) and TREM2 (purple) in fusion cells that THP1-induced LAM and SUM159PT or MDA-BA-231 after 3 days co-culture. Scale bars, 10μm. Marker assessment in two tumor cell lines adds model context to the observed events.
gDefine parental labels and clone isolation
Schematic illustration of obtaining fusion cells through in vitro co-culture. WT-mCherry-NLS indicates mCherry-nucleus-located SUMT159 and MDA-MB-231, LAM-GFP indicates GFP-expressed LAM. Defined parental labels and sorting steps make subsequent double-positive observations interpretable.
hInspect the post-sort composition
The first day after FACS. The pie chart of fusion cells, tumor cells, LAM and cell debris in Figure S 3d. The mixed post-sort composition explains why subsequent clone validation is necessary.
iTest the response to CyD treatment
The ratio of fusion cells / malignant cells of the effect of CyD treatment. LAM were treated with different concentration of CyD for 2h before co-culture with tumor cells. The ratio of fusion cells / malignant cells = (FITC+ PE+) / PE+. Data are presented as the mean ± SD. ns, no significance. * p < 0.05, ** p < 0.01, *** p < 0.001,**** p < 0.0001, one-way ANOVA with one-way ANOVA with Dunnett’s post test. This perturbation adds an experimental comparison without serving as the sole proof of fusion origin.
jInspect the resulting cells by confocal imaging
The confocal images of fusion cells Scale bars, 10μm. Read with the sorting workflow to inspect morphology and labeling of the obtained cells.
kCompare cellular ultrastructure
Representative pictures of transmission electron microscopy show the nucleus (N), mitochondrial (M) and lipid droplet (L) of MDA-MB-231, LAM and fusion cells. E, extracellular vesicles. Scale bars, 5 or 0.5μm. Nuclei, mitochondria and lipid droplets add ultrastructural information to optical imaging and marker analyses.
lInspect the clone's transcriptional program
Heatmap shows the expression level of fusion score, LAM signature scores, and macrophage markers between MDA-MB-231 and fusion cells in bulk RNA-seq. This tests whether fusion- and macrophage-associated programs persist in the obtained clones.
mLook for biparental genomic evidence
Venn diagram shows the overlap of the specific mutation sites among MDA-MB-231, LAM and fusion cells, n=1 per group. Parental mutation comparisons add origin evidence independent of staining and transcription, within the stated sample scope.
nInspect a specific matched locus
IGV screenshot of the identical mutation sites of NIPBL in the fusion cell line shared with two parental cell lines. For c, e, i and l, n = 3 per group were used for analysis. A locus-level example makes the overlap summarized in m directly inspectable.
Takeaway
The argument advances from two marker types in a cell to culturable clones and biparental genomic evidence, with complementary identity checks. These experimentally established cells enable Figure 4 to compare their function with the parental tumor cells.
Fusion cells exhibit enhanced malignancy and metastatic potential compared to the parental lines
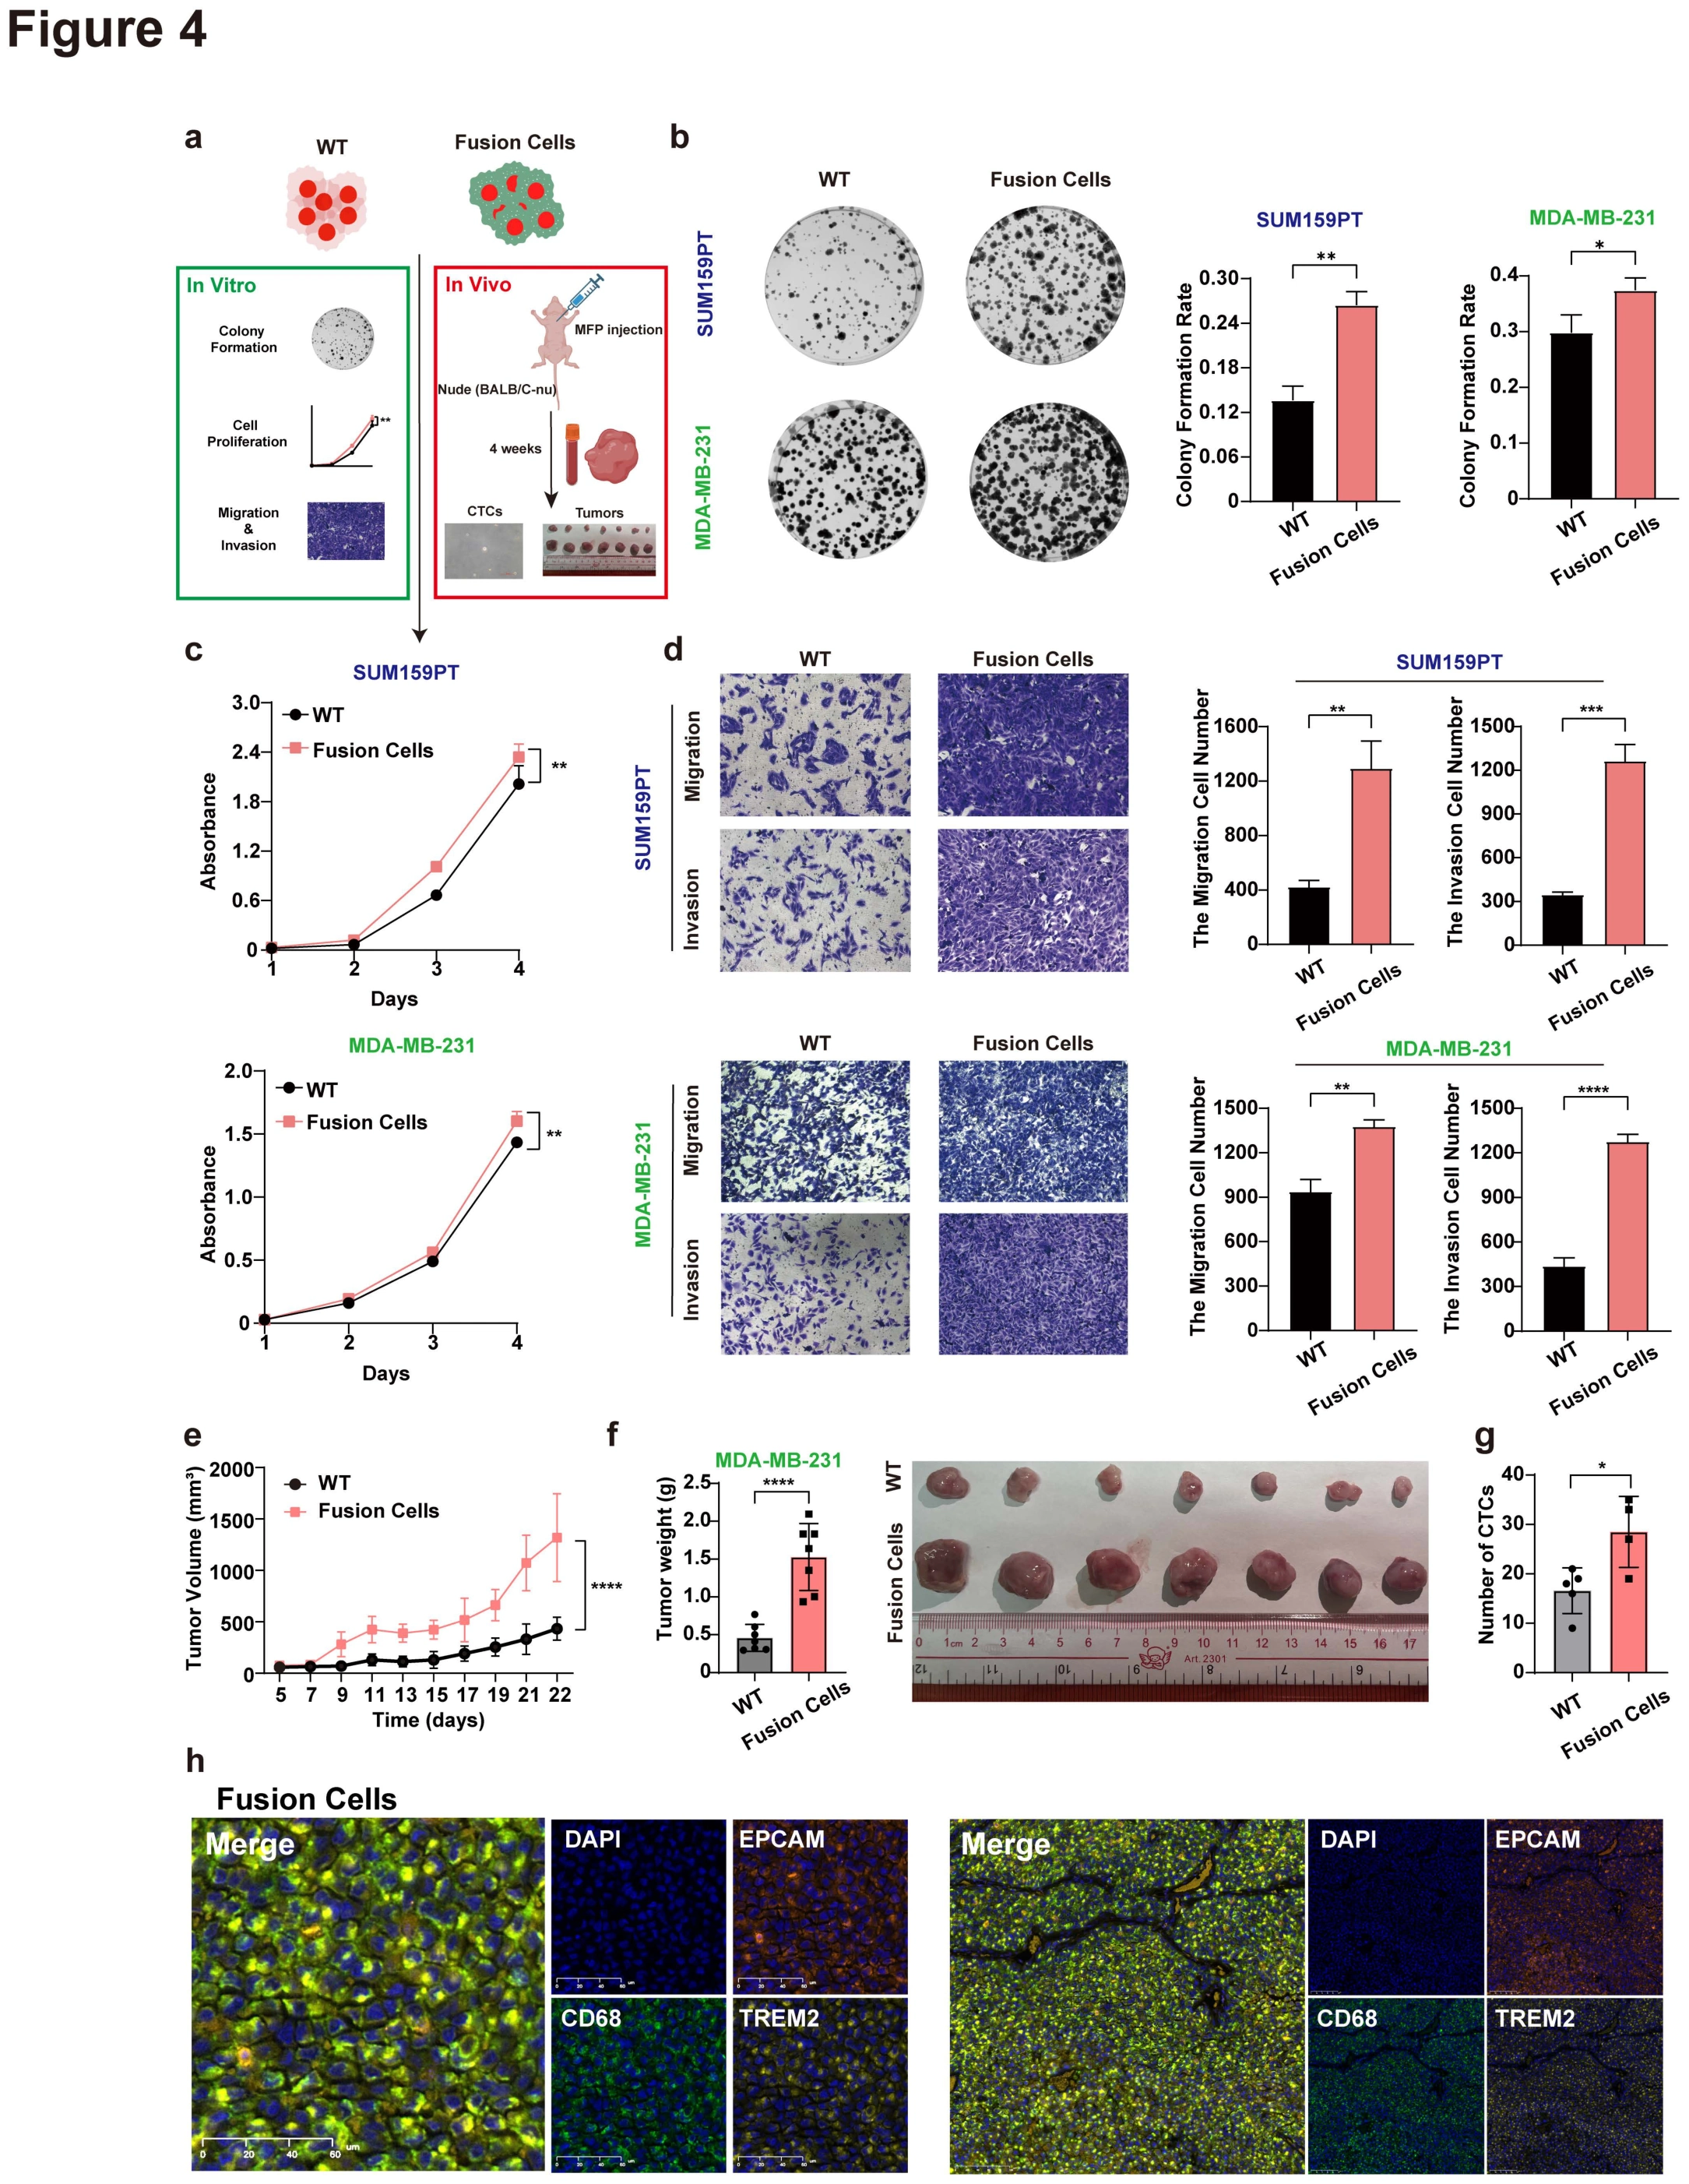
With candidate fusion clones established, this figure tests functional differences from parental tumor cells. Panel a defines the comparison, b–d examine clonogenic growth, proliferation and invasion-related behavior, and e–h extend testing to mammary-fat-pad tumors, circulating cells and tissue markers.
aDefine parental and fusion-clone comparisons
Schematic diagram of in vivo and in vitro experiments with fusion cells and WT tumor cells. A common comparison makes the separate functional assays part of one evidence chain.
bMeasure clonogenic growth
Representative figures (left) of colonies and the colony formation rate (right) in WT tumor cells and paired fusion cells. Data are presented as the mean ± SD. * p < 0.05, ** p < 0.01, two-way ANOVA with Bonferroni’s post test. Clonogenic growth complements short-term viability measurements by examining colony establishment.
cCompare proliferation over time
CCK8 proliferation assay of WT tumor cells and paired fusion cells. SUM159PT (top) and MDA-MB-231 (bottom). Data are presented as the mean ± SD. ** p < 0.01, two-way ANOVA with Bonferroni’s post test. Two models are compared over time rather than using only one endpoint count.
dTest migration and invasion
Migration and invasion assays of WT tumor cells and paired fusion cells using transwell assay. SUM159PT (top) and MDA-MB-231 (bottom). Representative figures (left) and quantitative analysis (right). Data are presented as the mean ± SD. * p < 0.05, ** p < 0.01, *** p < 0.001, **** p < 0.0001, two-way ANOVA with Bonferroni’s post test. This separates growth-related advantages from motility and barrier-traversal behaviors.
e–hConnect tumor growth, blood and tissue readouts
1×10⁶ WT (MDA-MB-231) or fusion cells were injected into the mammary fat pad of 6 weeks old female nude mice, n=7 per group. Tumors growth curves (e), Quantitative analysis (left) and photograph (right) and of tumors (f). Boxplot of the number of CTCs isolated from mice, n=5 per group (g). Multiplex immunohistochemistry (h) shows DAPI (blue), EPCAM (orange), CD68 (green) and TREM2 (yellow) in the tumors of fusion cells groups, each stain was shown separately and merged. The left diagram was a magnified structure of the right diagram. Scale bars, 20μm. Data are presented as the mean ± SD. * p < 0.05 **** p < 0.0001. P value in e was determined using two-way ANOVA with Bonferroni’s post test, and in f and g were determined using two-tailed Student’s t-test. The supplied legend groups these panels as e–i, whereas this supplied main-figure sheet is lettered through h; no additional panel i is inferred. Tumor growth, CTC counts and retained markers describe complementary model features rather than interchangeable measures of metastasis.
Takeaway
The figure moves from differing identity to differing function through complementary in vitro and in vivo comparisons. Figure 5 next investigates SNX10 as a molecular factor that could influence fusion and tumor-cell behavior.
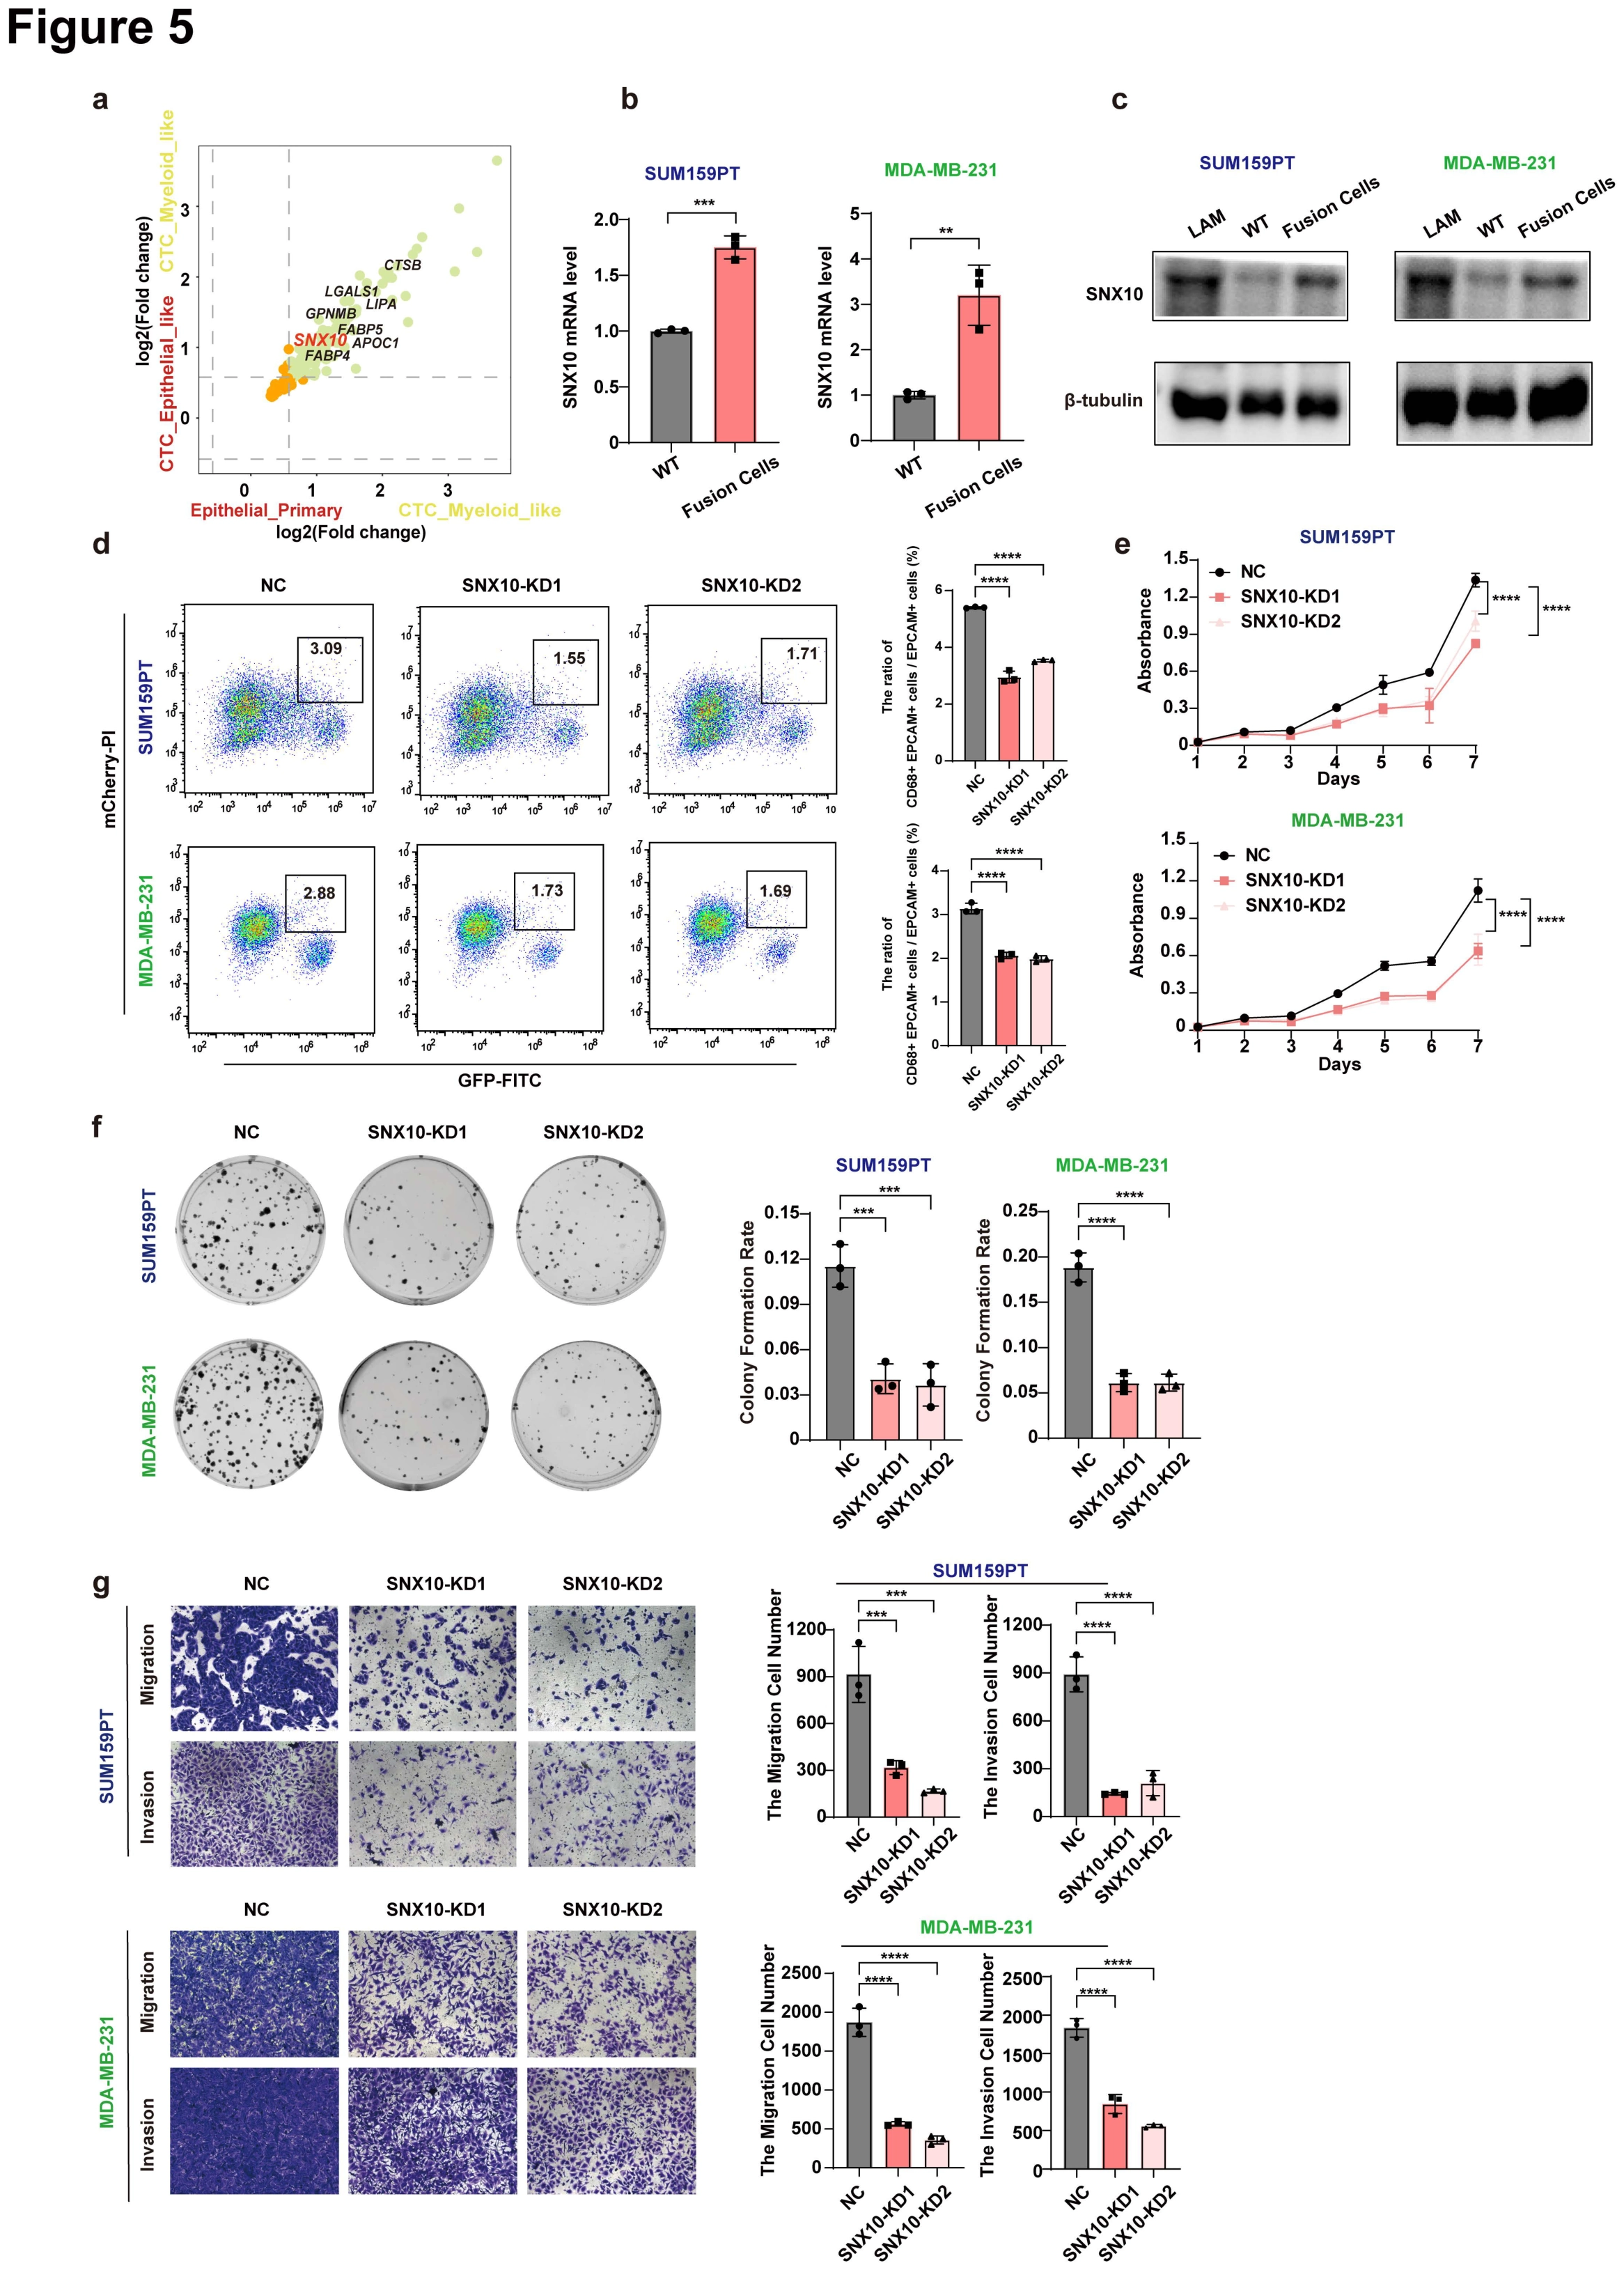
SNX10 promotes tumor-LAM fusion and the malignancy of breast cancer cells
After characterizing clone function, this figure asks whether SNX10 contributes to the state. Panels a–c identify the expression candidate, d tests fusion frequency after depletion, and e–g measure growth, migration and invasion to examine distinct cellular consequences.
aIntegrate expression comparisons to nominate a candidate
Quadrant analysis showing the overlap of DEGs in myeloid cells versus epithelial cells in primary and epithelial-like CTCs. Cross-population comparisons prioritize shared candidates rather than high expression in only one cell line.
bCompare SNX10 transcripts in parents and clones
The mRNA level of SNX10 between SUM159PT (left) and MDA-MB-231(right) and paired fusion cells. Data are presented as the mean ± SD. ** p < 0.01, *** p < 0.001, two-tailed Student’s t-test. The paired models connect the expression candidate to the experimental system.
cInspect the SNX10 protein comparison
The protein level of SNX10 among LAM, WT tumor cells and fusion cells. Comparing LAMs, parental cells and fusion cells clarifies the cellular context of the candidate protein.
dTest fusion frequency by depletion
Flow cytometry analysis (left) in NC cells and SNX10-KD cells of SUM159PT and MDA-MB-231 after co-culture with LAM, and the quantitative analysis (right) of the effect of SNX10 knockdown on the fusion ratio. The ratio of fusion cells / malignant cells = (FITC+ PE+) / PE+. Data are presented as the mean ± SD. **** p < 0.0001, two-way ANOVA with Bonferroni’s post test. Depleting SNX10 moves from association to a test of its contribution to event frequency.
eMeasure the proliferation response
CCK8 proliferation assay in NC cells and SNX10-KD cells of SUM159PT (top) and MDA-MB-231 (bottom). Data are presented as the mean ± SD. **** p < 0.0001, one-way ANOVA with Dunnett’s post test. Proliferation is another depletion response and should be distinguished from the fusion-frequency readout in d.
fExamine clonogenic growth
Representative figures of colonies and the colony formation rate of NC cells and SNX10-KD cells of SUM159PT (top) and MDA-MB-231 (bottom). Data are presented as the mean ± SD. *** p < 0.001,**** p < 0.0001, one-way ANOVA with Dunnett’s post test. This complements proliferation by testing sustained colony-forming behavior.
gMeasure motility and invasion responses
Migration and invasion of NC cells and SNX10-KD cells in SUM159PT (top) and MDA-MB-231 (bottom) using transwell assay. Representative figures (left) and the quantitative analysis (right). Data are presented as the mean ± SD. *** p < 0.001,**** p < 0.0001, one-way ANOVA with Dunnett’s post test. For b, d-f and e, n = 3 per group were used for analysis. Distinct functional endpoints examine SNX10 perturbation without reducing all effects to proliferation.
Takeaway
SNX10 progresses from an expression marker into a perturbable functional candidate. Figure 6 then asks how it acts, testing whether association with and stabilization of ANO6 connects SNX10 to fusion.
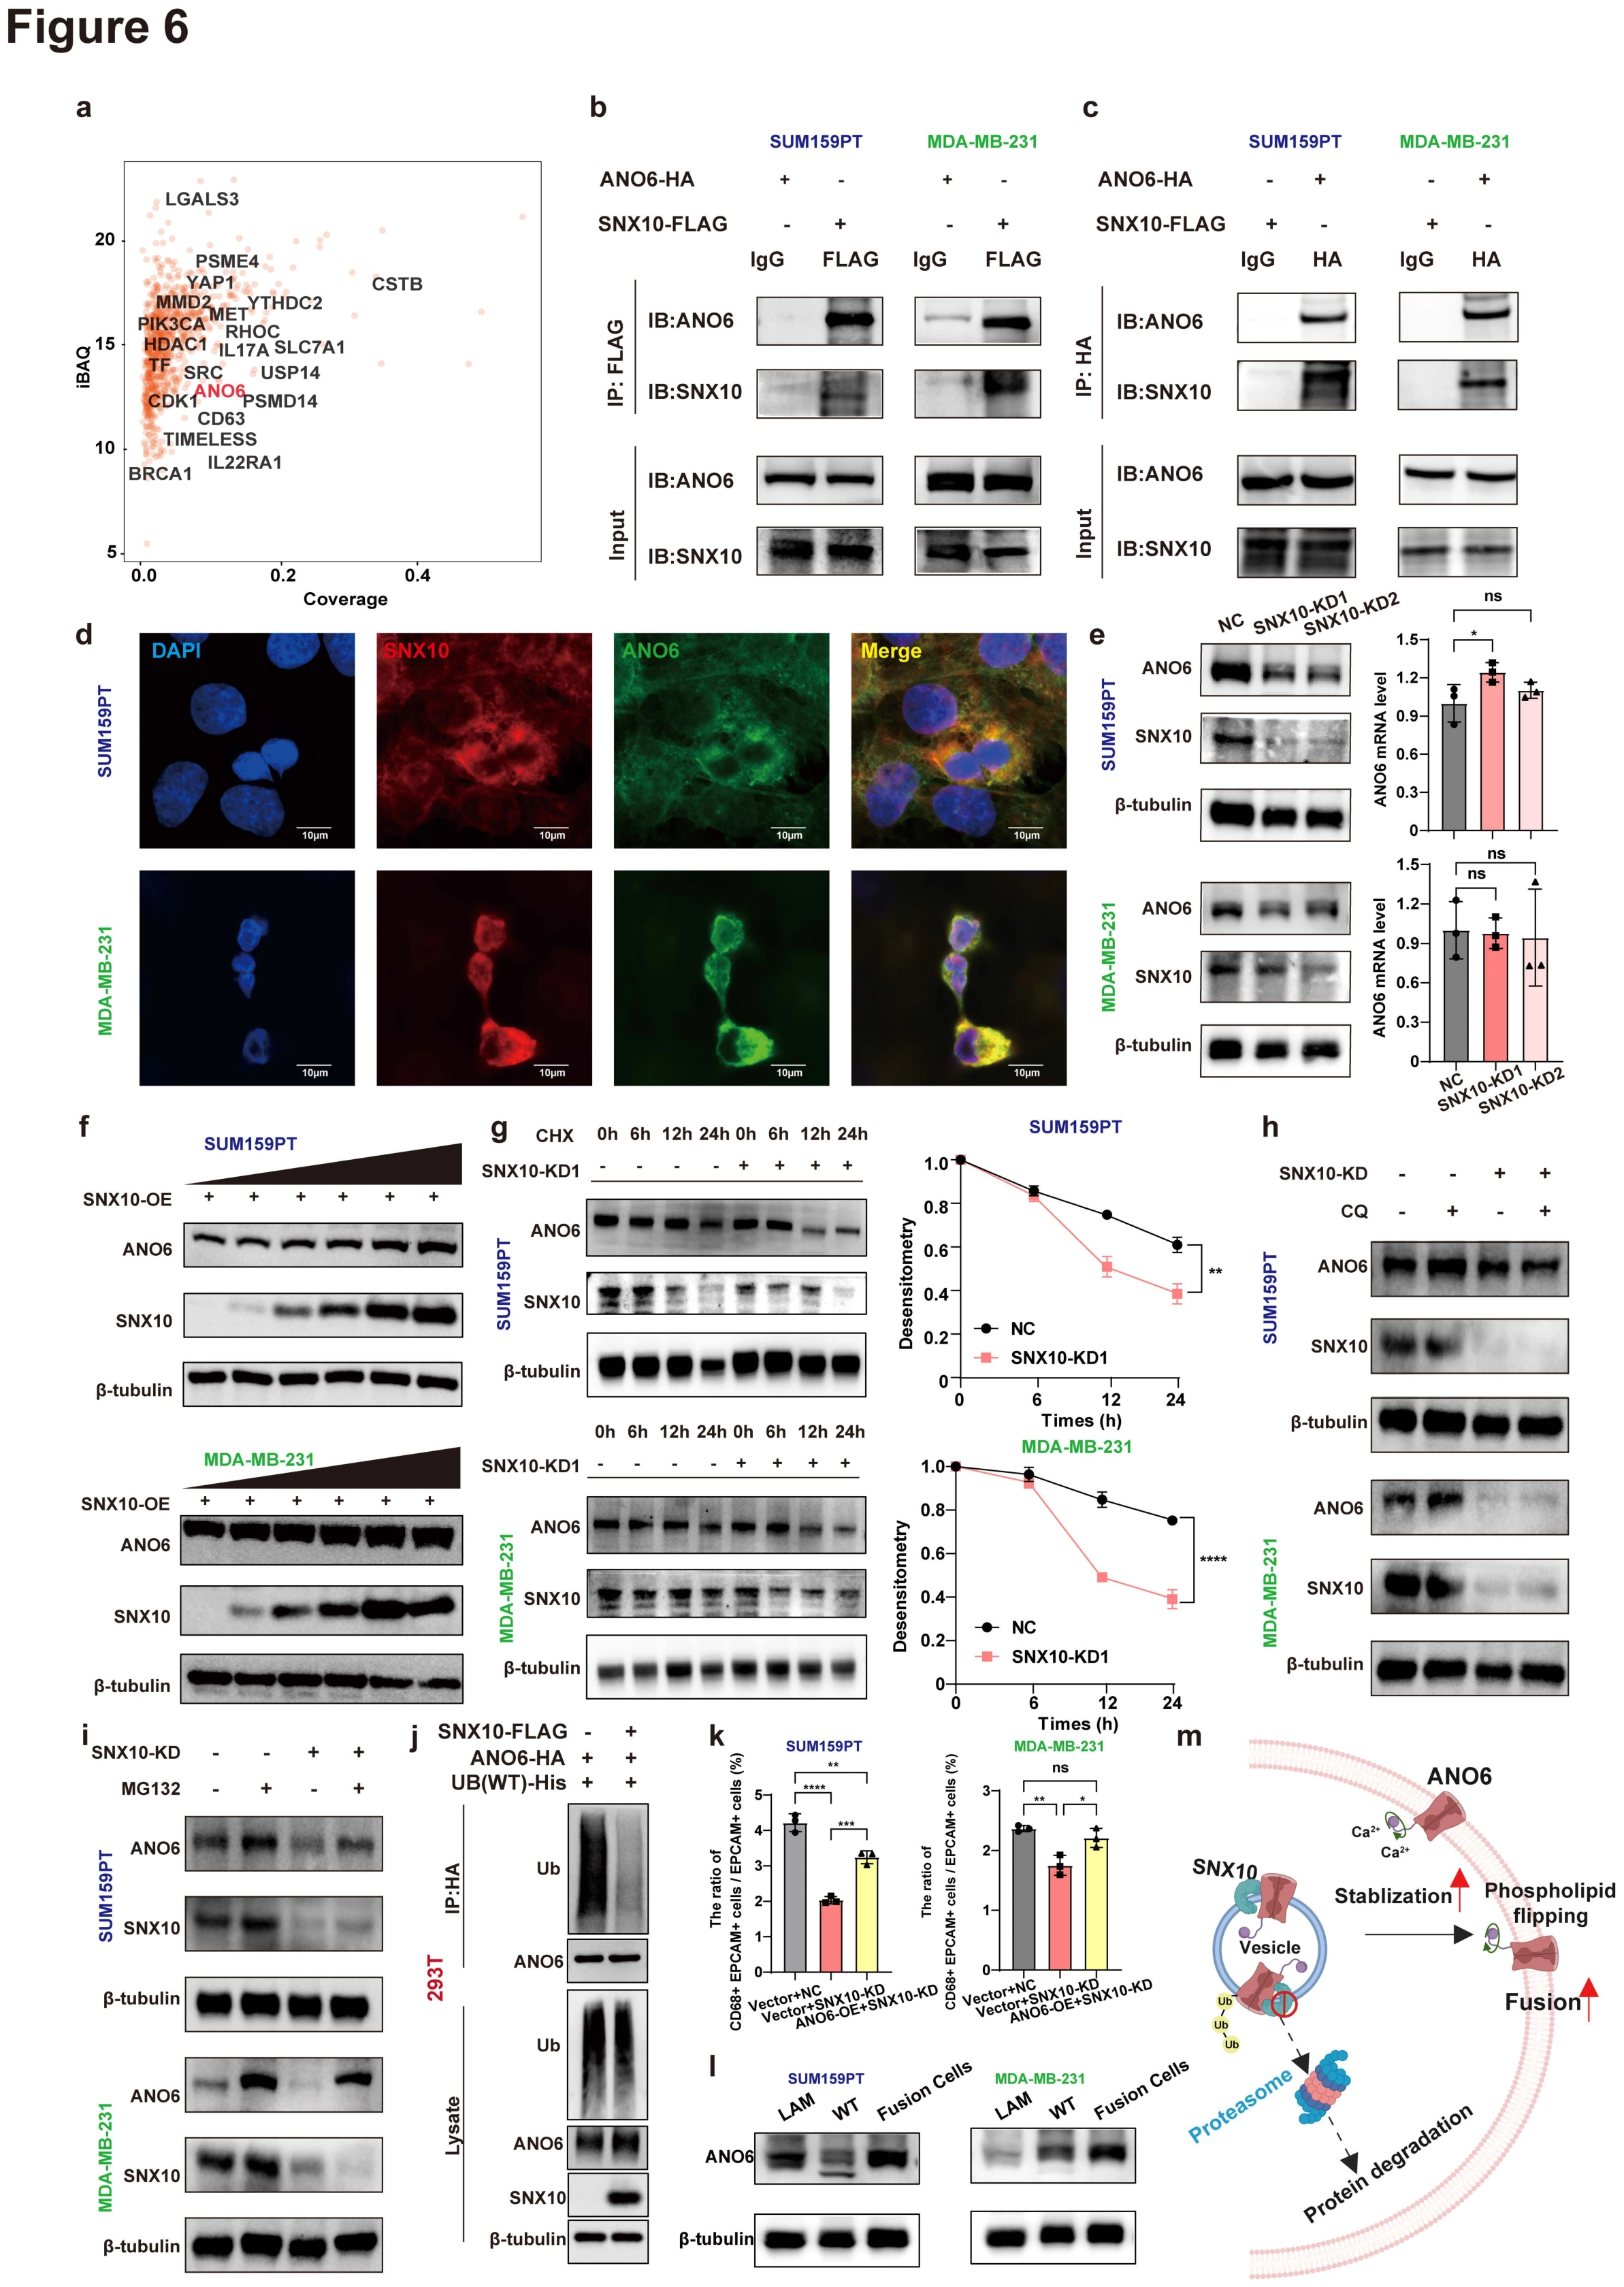
SNX10 protein physically interacts with ANO6 and maintains its protein stability
This figure resolves the SNX10 question at the protein level. Panels a–d investigate ANO6 association, e–j distinguish transcript, protein stability and degradation-related steps, k tests the functional link by restoring ANO6, and l–m summarize the cellular context and model.
aScreen candidate protein partners
Mass spectrometry analysis showing the proteins potential physical interact with SNX10. iBAQ (Intensity-Based Absolute Quantification) indicates the total amount of protein. Coverage indicates the peptide coverage of protein. Mass spectrometry nominates partners for the targeted association assays that follow.
b-cVerify association with reciprocal assays
Co-IP with anti-FLAG (b) or anti-HA (c) antibody in SUM159PT or MDA-MB-231 revealed the physical interaction between SNX10 and ANO6 proteins. The different immunoprecipitation directions provide complementary tests of SNX10–ANO6 association.
dInspect cellular localization of both proteins
Immunofluorescence staining was performed for DAPI (blue), SNX10 (red), and ANO6 (green) in SUM159PT and MDA-MB-231 cell lines with each stain was shown separately and merged. Scale bars, 10μm. Colocalization supplies spatial context but does not alone establish physical interaction.
eSeparate transcript and protein responses
The protein level of ANO6 and SNX10 (left), and the effect of SNX10 knockdown on the mRNA level of ANO6 (right) in SUM159PT and MDA-MB-231. Data are presented as the mean ± SD. ns, no significance. * p < 0.05, one-way ANOVA with Dunnett’s post test. Their comparison helps distinguish a protein-stability mechanism from a solely transcriptional explanation.
fExamine the dose-related protein response
SNX10 stabilized ANO6 protein in a dose-dependent manner in SUM159PT and MDA-MB-231. ANO6 measurements across SNX10 conditions add a graded comparison of the regulatory relationship.
gTrack protein change over time
The effect of CHX treatment and greyscale analysis of the results in NC cells and SNX10-KD cells of SUM159PT and MDA-MB-231. Cells were treated with 200μg/ml CHX for indicated time. Data are presented as the mean ± SD. ns, no significance. ** p < 0.01*** p < 0.001, **** p < 0.0001, two-way ANOVA with Bonferroni’s post test. The time course moves beyond static abundance differences to testing protein turnover.
hTest one degradation-related perturbation
The effect of CQ treatment in NC cells and SNX10-KD cells of SUM159PT and MDA-MB-231. Cells were treated with 40μM CQ for 24h. Read alongside i to compare the ANO6 response to different degradation-related treatments.
iTest the proteasome-related perturbation
The effect of MG132 treatment in NC cells and SNX10-KD cells of SUM159PT and MDA-MB-231. Cells were treated with 10μM MG132 for 24h. Together with h and the time course in g, this narrows the proposed degradation route.
jInspect ubiquitination-associated protein status
HEK293T cells transfected with Ub-His and ANO6-HA, SNX10-FLAGor the empty plasmids were subjected to IP with anti-HA antibody and immunoblotted with the indicated antibodies. This adds molecular evidence concerning ubiquitination to the degradation-related interpretation.
kTest the functional chain by restoring ANO6
The quantitative analysis of the fusion ratio among the NC cells, SNX10-KD, and SNX10-KD-ANO6-OE cells of SUM159PT and MDA-MB-231. The ratio of fusion cells / malignant cells = (FITC+ PE+) / PE+. Data are presented as the mean ± SD. ns, no significance. * p < 0.05, ** p < 0.01, **** p < 0.0001, one-way ANOVA with Bonferroni’s post test. Restoring the downstream protein in SNX10-depleted cells tests its contribution to the same fusion endpoint.
lReturn to parental and fusion-cell comparisons
The protein level of ANO6 among LAM, WT tumor cells and fusion cells. This places the proposed mechanism back into the original three-cell-type comparison.
mSummarize the SNX10–ANO6 mechanism
Schematic illustration of SNX10-ANO6-fusion axis. For e, g, and k, n = 3 per group were used for analysis. The schematic integrates association, turnover and restoration experiments rather than adding independent evidence.
Takeaway
The key progression is from two proteins changing together to association, turnover and functional restoration, rather than deriving the mechanism from colocalization alone. Figure 7 then moves upstream to test CBX3 regulation of SNX10 expression.
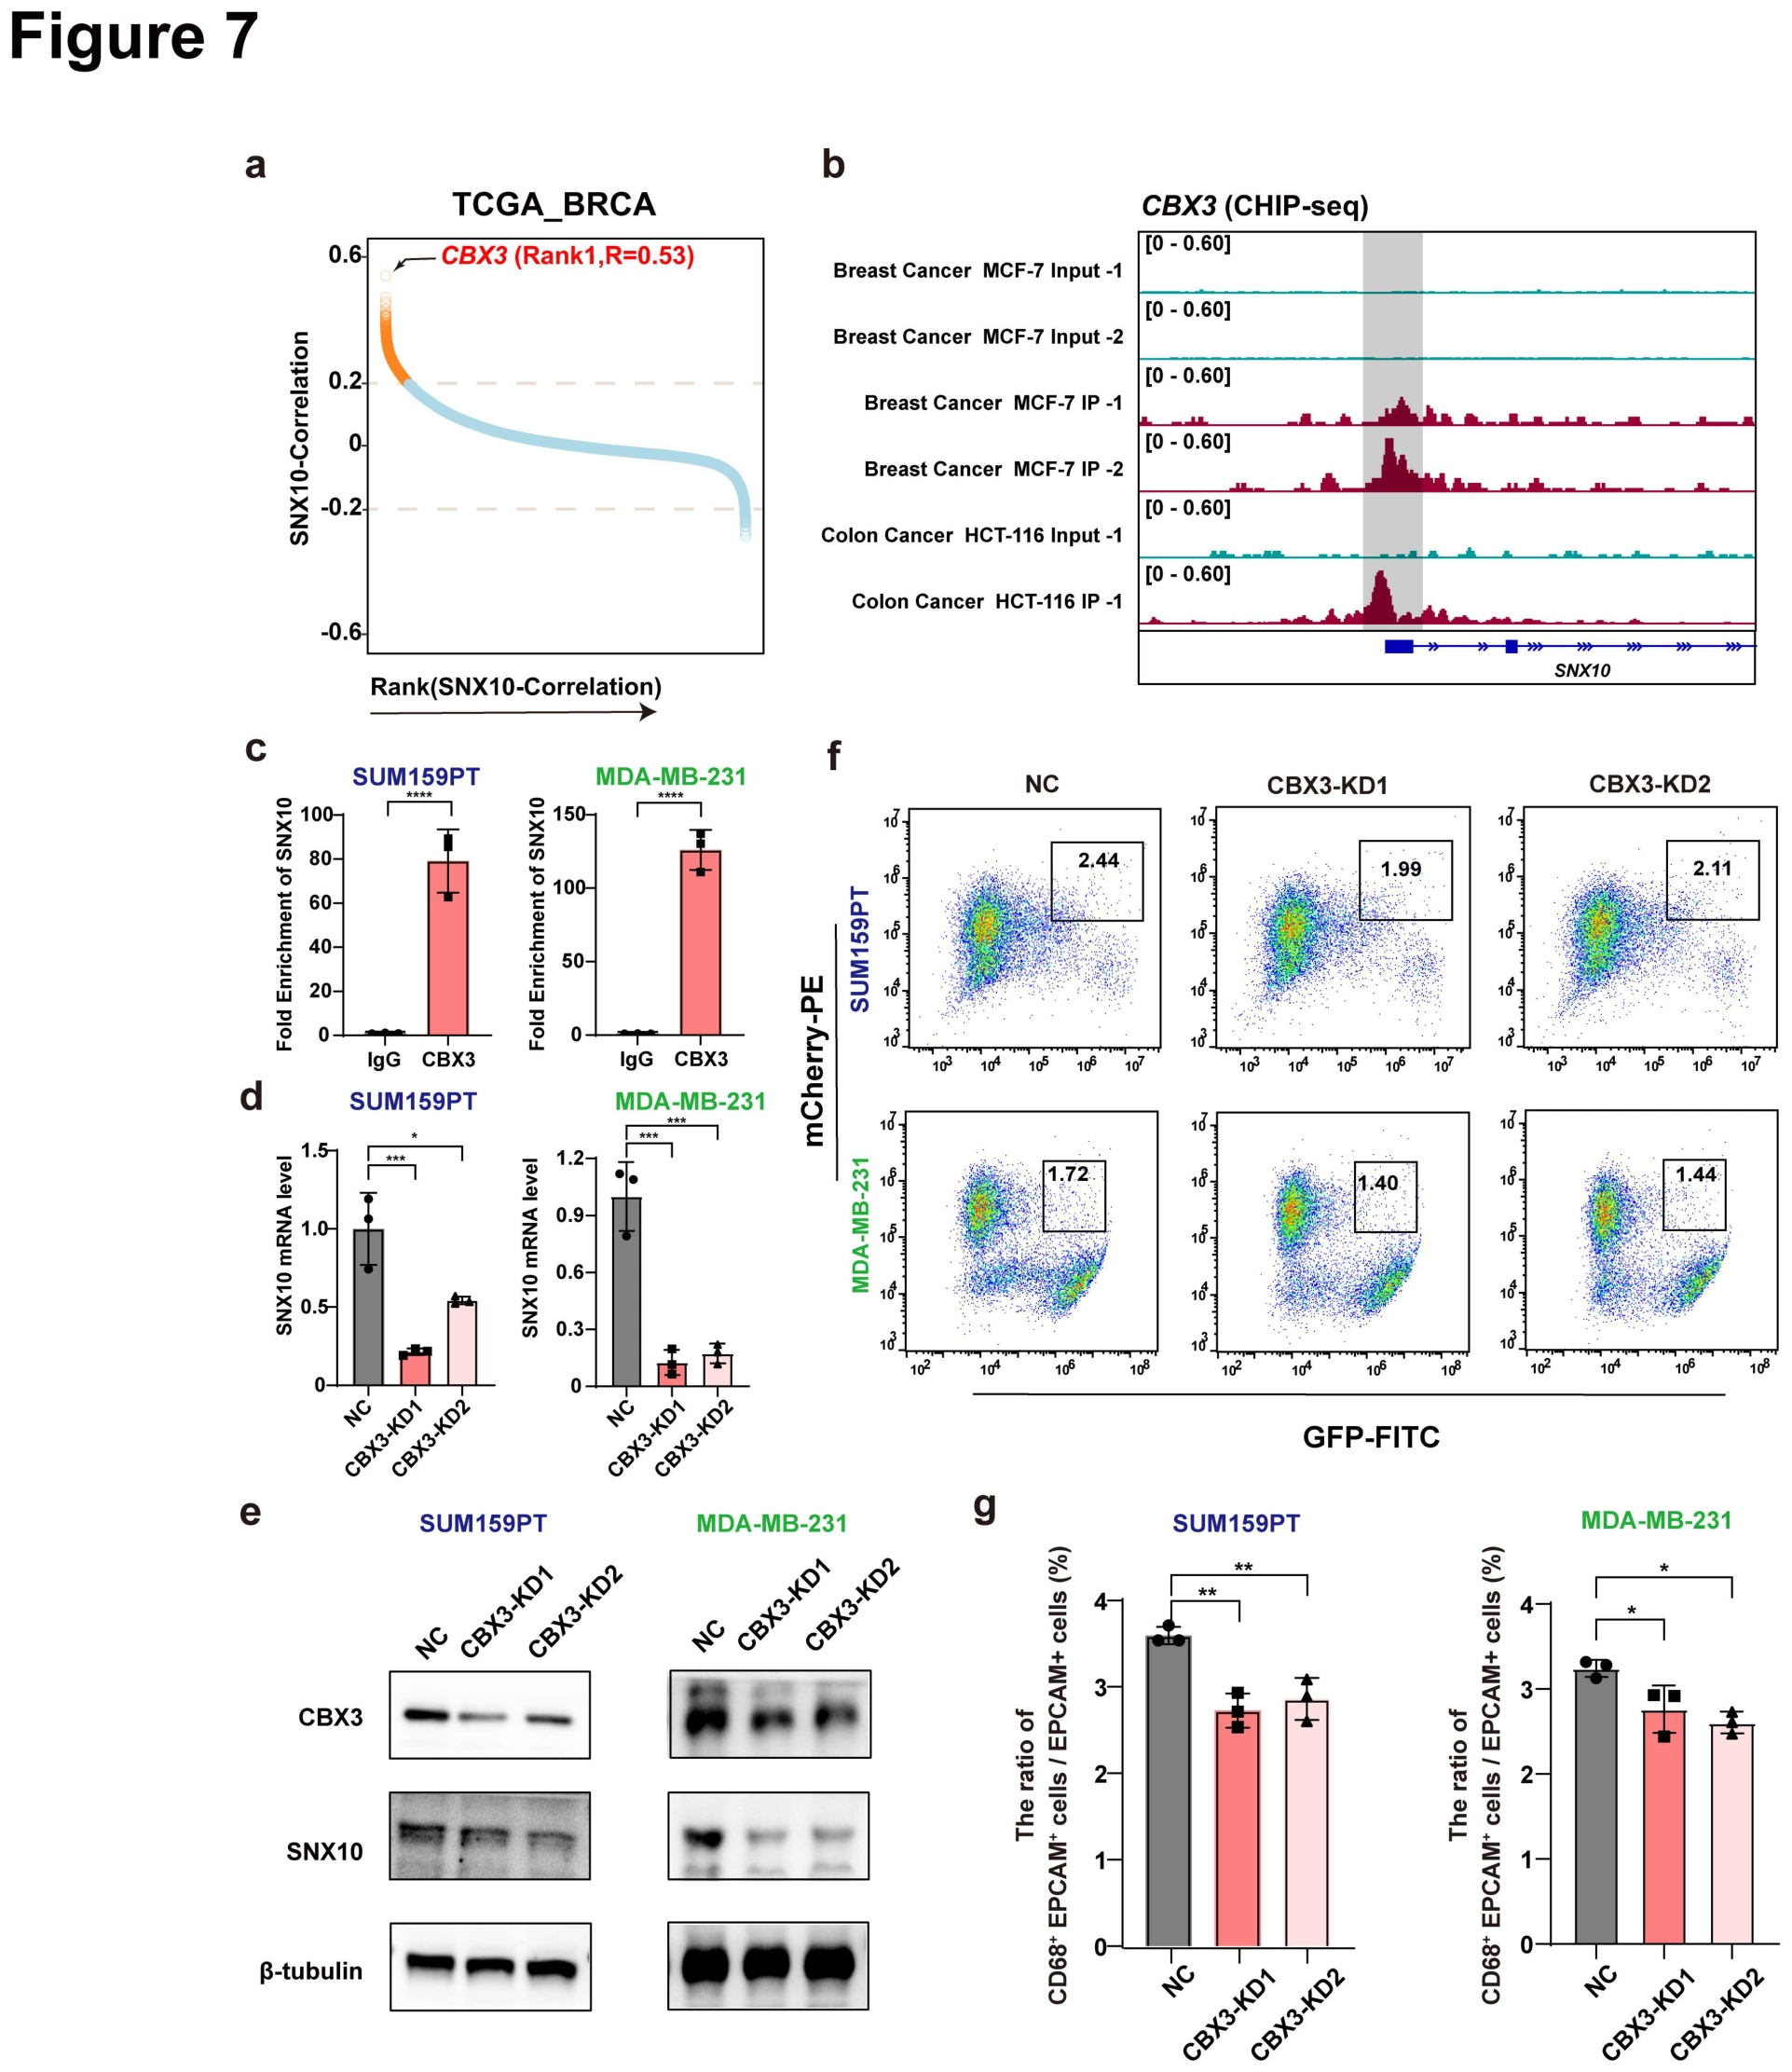
CBX3 transcriptionally regulates SNX10 expression and promotes tumor-LAM fusion
After examining the downstream SNX10–ANO6 mechanism, the final figure asks what regulates SNX10 expression. Panels a–b nominate CBX3 using correlation and binding data, c–e test promoter occupancy and expression responses, and f–g reconnect the regulatory relationship to fusion frequency.
aScreen upstream factors by correlation
Correlation ranking of the expression levels of all transcription factors and SNX10 in TCGA-BRCA. Y-axis indicates the correlation with SNX10, genes ordered by correlation along the X-axis. Ranking nominates candidates such as CBX3 without alone establishing regulatory direction.
bInspect binding clues at the candidate locus
IGV screenshot of CBX3 ChIP signals in BRCA and CRC cell lines. Binding tracks motivate promoter-occupancy testing in the study models.
cValidate promoter occupancy in the models
Fold enrichment of CBX3‐binding sites in SNX10 promoter of SUM159PT and MDA-MB-231 determined by ChIP‐qPCR. Data are presented as the mean ± SD. **** p < 0.0001, two-tailed Student’s t-test. ChIP-qPCR brings the locus-level hypothesis into an experimental test in the specified cell models.
d-eTest expression regulation by depletion
The effect of CBX3 knockdown on the mRNA level of CBX3 and SNX10 (d), and the protein level of CBX3 and SNX10 (e) in SUM159PT and MDA-MB-231. Data are presented as the mean ± SD. * p < 0.05, *** p < 0.001, one-way ANOVA with Dunnett’s post test. Transcript and protein responses connect promoter occupancy to downstream expression.
f-gConnect upstream regulation to fusion frequency
Flow cytometry analysis (f) in NC cells and CBX3-KD cells of SUM159PT and MDA-MB-231 after co-culture with LAM, and the quantitative analysis (g) of the effect of CBX3 knockdown on the fusion ratio. The ratio of fusion cells / malignant cells = (FITC+ PE+) / PE+. Data are presented as the mean ± SD. * p < 0.05, ** p < 0.01, *** p < 0.001, **** p < 0.0001, one-way ANOVA with Dunnett’s post test. For d-e and h, n = 3 per group were used for analysis. Fusion-frequency measurements reconnect the upstream regulatory experiment to the cellular event at the center of the study.
Takeaway
The figure series begins with clinical candidate cells, establishes biparental clones, compares function and arrives at the CBX3–SNX10–ANO6 regulatory framework. Clinical marker co-occurrence, fusion in culture and function in tumor models remain distinct, connected levels of evidence.
My contribution
I contributed to single-cell isolation and library preparation from clinical blood samples, cultured the fusion and control cells, established orthotopic CDX models and performed in vivo imaging. I also assisted with tissue collection and downstream sample processing.
Outcomes & record
The related paper, “Fusion of tumor cells with lipid-associated macrophages drives metastatic progression of breast cancer,” was published in Cancer Research in 2025. I am a coauthor, with my research contribution centered on the sample, cell and animal-model work described here.