Biomed / 04
FTO transfer & vascular remodeling in NPC
Studies the transfer of FTO from tumor cells to endothelial cells and its role in vascular remodeling and metastasis in nasopharyngeal carcinoma. Published in Advanced Science; I am a coauthor.
- Publication status
- Published
- Journal
- Advanced Science
Abstract
Cancer stem‐like cells (CSCs) in nasopharyngeal carcinoma (NPC) exhibit heightened stemness, invasiveness, and resistance to therapy, posing significant challenges for diagnosis and treatment. How CSCs interact with the endothelium to drive vascular remodeling and metastasis remains unclear. Using spatially resolved multi‐omic profiling of clinical NPC samples and experimental validation, a tumor‐endothelial crosstalk mechanism is identified, driven by the NOTCH1–FTO–SPARC axis.
Omics analysis reveals a distinct NOTCH1⁺ CSC subpopulation with enhanced tumorigenic potential. FTO, a direct transcriptional target and key effector of NOTCH1, promotes vascular remodeling and metastasis. Notably, NOTCH1⁺ tumors secreted FTO via exosomes, which are readily taken up by endothelial cells. Within recipient endothelial cells, accumulated FTO disrupts endothelial tight junctions by suppressing YTHDF2‐mediated m6A modification, stabilizing SPARC mRNA, and increasing SPARC protein levels.
Inhibition of FTO with DAC51 significantly suppresses metastasis in NPC mouse models. Clinically, metastatic NPC patients show elevated levels of NOTCH1⁺ CSC‐CTCs (EPCAM⁺ EBNA1⁺ NOTCH1⁺ CD45−) and plasma FTO, suggesting their potential as blood‐based biomarkers for monitoring disease progression and treatment response. Overall, this study uncovers a non‐cell‐autonomous role of FTO in driving metastasis, with potential diagnostic and therapeutic utilities for NPC.
Read paper ↗Figures
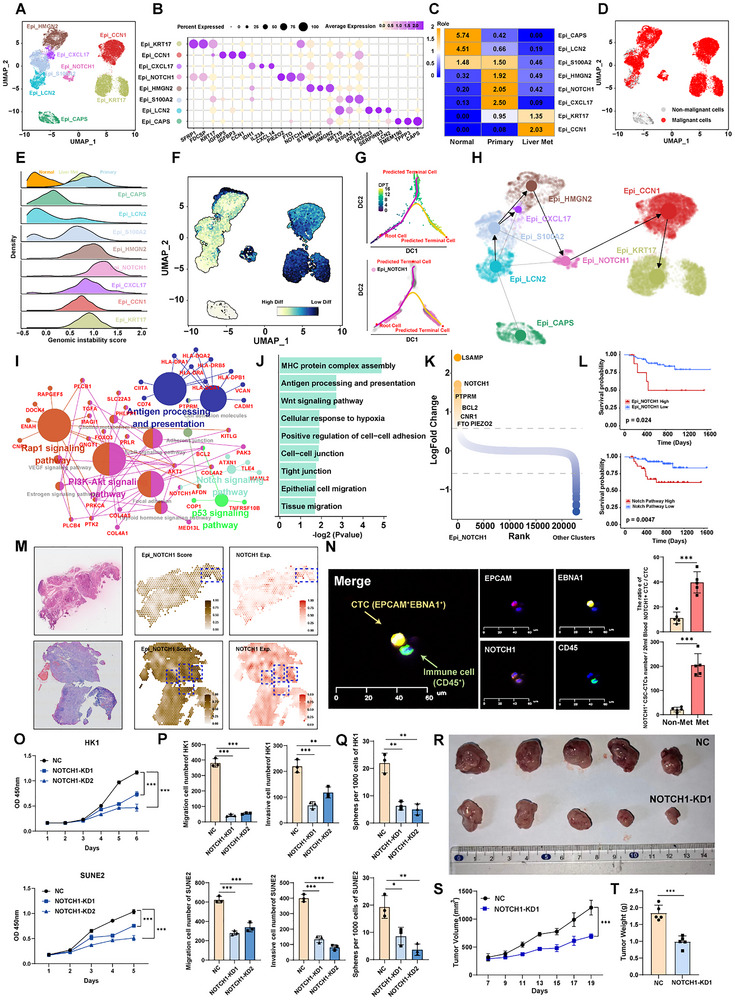
NOTCH1+ cancer stem‐like cells exhibit enhanced tumorigenicity and metastatic potential
The study begins by locating an NPC epithelial state with stem-like and metastasis-associated features. A–H define its identity and differentiation context, I–N connect molecular programs with patient, tissue and blood observations, and O–T test functional relevance through NOTCH1 depletion.
AMap epithelial states
UMAP plot showing the subtypes of epithelial cell, each dot indicates a single cell. Color‐coded for the cell type. This atlas supplies the cellular framework for the subsequent mechanistic analysis.
BCheck population identity
Dot plot showing the selected markers for each subtype of epithelial cell. Dot size indicates the fraction of expressing cells, and the colors represent normalized gene expression levels. Marker expression connects the clusters in A to interpretable cellular states.
CCompare tissue provenance
Tissue prevalence estimated by Ro/e score in epithelial cells. This asks whether states preferentially occur in particular sampled tissues, beyond their positions in the atlas.
DIdentify malignant cells
UMAP plot showing malignant and non‐malignant cells, as defined by inferCNV. Separating malignant identity from stem-like state is a prerequisite for the later tumorigenicity argument.
ECompare genomic instability
Ridgeline plot showing the genomic instability score of eight malignant cell subtypes from three different tissues. This complements D with subtype- and tissue-resolved genomic-instability estimates.
FAssess differentiation state
UMAP plot showing the CytoTRACE scores of all epithelial cell subpopulations. CytoTRACE scores ranged from 0 to 1 with high scores indicating low differentiation status and low score indicating high differentiation. This is an inferred differentiation state, later complemented by functional assays rather than a direct self-renewal measurement.
GPlace the population along pseudotime
Diffusion pseudotime (DPT) trajectory analysis showing cellular transitions from the root cell to predicted terminal cells. The top plot shows the pseudotime, while the bottom plot shows the cells from Epi_NOTCH1 subpopulation. Locating the candidate population along the inferred transitions clarifies its relative differentiation context.
HCross-check inferred state relationships
UMAP showing the RNA velocity and PAGA of 8 epithelial cell subtypes. Read with F–G to compare the state relationships inferred by different computational approaches.
IConnect pathways to their genes
Network diagram showing enriched KEGG pathways and their associated genes in Epi_NOTCH1 subpopulation. Larger nodes represent enriched pathways. The network translates candidate phenotypes into molecular programs that can be investigated experimentally.
JSummarize enriched programs
Bar graph showing the pathway enriched in the Epi_NOTCH1 subpopulation. The x‐axis indicates the ‐log2 P value. This summarizes pathway-level findings and provides the molecular context for focusing on NOTCH1.
KIdentify population-specific expression
Differential expressed genes between NOTCH1+ cancer stem‐like cells and the other cell subtypes. Y‐axis indicates the log2foldchange, genes ordered by log2foldchange along the x‐axis. Differential genes nominate downstream candidates without themselves demonstrating regulatory relationships.
LExamine associations with patient outcome
Kaplan–Meier estimation of progression‐free survival (PFS) time in NPC patients by Epi_NOTCH1 subpopulation signature score (top) and Notch pathway activity score (bottom). Population and pathway scores are related but distinct readouts whose survival associations should be read separately.
MLocate transcriptional features in tissue
H&E‐stained tissue (left panel), Epi_NOTCH1 subpopulation signature score (middle panel) and the expression levels of NOTCH1 (right panel) based on spatial transcriptomic analysis of primary NPC sample from patients. Spatial data complement dissociated-cell analysis by locating the candidate state within tissue.
NExamine the corresponding blood-cell state
Multi‐immunofluorescence (mIF) staining of circulating tumor cells (CTCs) showing DAPI (nuclei), EPCAM (epithelial marker), NOTCH1, and CD45 (leukocyte marker) (left panel). EPCAM+EBNA1+ cells identified as CTCs. CD45+ cells are identified as immune cells. Barplot showing the percentage and number of NOTCH1+ CSC‐CTCs between non‐metastasis and metastasis NPC patients (right panel). Cell-identity markers precede the comparison of NOTCH1-positive CTC measurements between clinical groups.
OTest NOTCH1 dependence of proliferation
CCK‐8 assay showing the effect of NOTCH1 knockdown on the proliferation of HK1 and SUNE2 cells, demonstrating reduced cell growth upon NOTCH1 silencing. Depletion moves from expression-based observation to testing the pathway's contribution to cell behavior.
PExtend functional testing to motility
Transwell migration and invasion assays assessing the impact of NOTCH1 knockdown on the migration and invasion abilities of HK1 and SUNE2 cells, with significant inhibition observed in both cell lines. Distinct from O, these assays examine migration and invasion-related behavior.
QMeasure sphere-forming capacity
The effect of NOTCH1 expression change (NOTCH1‐KD) on NPC cell sphere‐propagating capacity. This complements inferred stem-like scores without being treated as identical to tumor initiation in vivo.
R–TTest tumor growth in mice
5 × 10⁶ WT HK1 or NOTCH1‐KD HK1 cells were hypodermic injected into 8 weeks old nude mice, n = 5 per group. Photograph R), Tumors growth curves S), Quantitative analysis T). Data in (O–Q) are mean ± SD from 3 independent experiments, *p < 0.05, **p < 0.01, and ***p < 0.001 were determined by two‐way ANOVA with Bonferroni's post test. Images, longitudinal curves and quantification test whether the in vitro findings extend to this xenograft model.
Takeaway
This establishes the first chain: identify a candidate cell state, examine its clinical context and test functional dependence. Figure 2 then investigates FTO as a downstream effector through which NOTCH1 could act.
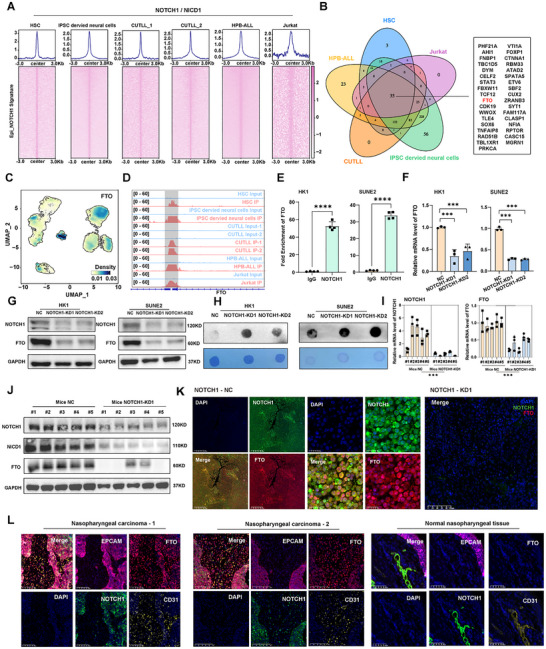
NOTCH1 regulates the expression of m6A mRNA demethylase FTO
After linking the NOTCH1-associated state to function, the study asks how it connects to RNA modification. A–D nominate FTO using binding datasets, E–H examine binding, expression and m6A in NPC cells, and I–L test the correspondence in xenografts and patient tissue.
ASearch binding data for candidate targets
Aggregation plots (top) and heatmaps (bottom) showing the NOTCH1 binding levels in HSC, iPSC‐derived neural cells, CUTLL1, CUTLL2, HPB‐ALL, and Jurkat cell lines. NOTCH1 Chip‐seq peaks within signatures from Epi_NOTCH1 were sorted in descending order based on the mean RPKM value per region. These external cell models support candidate selection, not a substitute for validation in NPC cells.
BNarrow the shared candidates
Venn diagram showing the overlap of NOTCH1 target genes based on NOTCH1 chip‐seq data across multiple cell lines, including HSC, HPB‐ALL, Jurkat, CUTLL, and iPSC‐derived neural cells. The intersection prioritizes targets supported across multiple source datasets.
CLocate FTO across cell states
UMAP plot showing the density distribution of FTO expression across epithelial subpopulations. The candidate is returned to the Figure 1 atlas to inspect its cellular context.
DInspect binding at the FTO locus
Binding of NOTCH1 to the FTO gene in HSC, HPB‐ALL, Jurkat, CUTLL, and iPSC‐derived neural cells. All peaks were called by MACS2 (p < 0.05). The genomic tracks identify candidate regions for the NPC-specific assay in E.
EValidate binding in NPC cells
ChIP‐PCR assay was performed to detect the extent of NOTCH1 binding to the FTO gene in HK1 and SUNE2 cells. This brings the cross-model binding hypothesis into the HK1 and SUNE2 systems used in the study.
FTest the FTO transcript response
RT‐qPCR analysis showing the mRNA expression levels of FTO in HK1 and SUNE2 cells following NOTCH1 knockdown. Measuring FTO after NOTCH1 depletion connects binding evidence to an expression response.
GCheck the protein counterpart
Western blot analysis displaying the NOTCH1 and FTO expression in HK1 and SUNE2 following NOTCH1 knockdown. Paired with F, this avoids inferring the effector protein solely from transcript abundance.
HAdd an RNA-modification readout
Dot blot analysis showing increased m6A modification levels in both HK1 and SUNE2 cells after NOTCH1 knockdown. Global m6A connects the response to FTO's molecular function without identifying a particular target transcript.
IRecheck the transcript response in tumors
RT‐qPCR analysis showing relative mRNA levels of NOTCH1 and FTO in xenograft tumors. This extends the culture-based expression relationship to xenograft tumors.
JInspect pathway proteins in tumors
Western blot analysis of NOTCH1, NICD1 (the intracellular domain of NOTCH1), and FTO in xenograft tumors with NOTCH1 knockdown. Measuring NOTCH1, NICD1 and FTO places upstream pathway state and the downstream effector side by side.
KAdd spatial correspondence within tumors
Multiplex immunohistochemical (mIHC) images showing the expression of NOTCH1 and FTO in xenograft tumors. In the NOTCH1 knockdown group, FTO expression is substantially diminished, as visualized by DAPI staining and merge panels. Staining complements bulk measurements in I–J by showing the tissue distribution of the FTO response.
LExamine patient tumor and normal tissue
mIHC showed the expression of FTO, EPCAM, NOTCH1, and CD31 in NPC tissues versus normal nasopharyngeal tissues. Data in (E,F and I) are mean ± SD from independent experiments, ***p < 0.001 and ****p < 0.0001 were determined by two‐way ANOVA with Bonferroni's post test. Tumor and vascular markers provide tissue context for the intercellular FTO-transfer question in the next figure.
Takeaway
Binding evidence, transcript and protein responses to depletion, and the m6A readout support a regulatory connection between NOTCH1 and FTO. Figure 3 then asks whether tumor-cell FTO also reaches endothelial cells and affects the vascular barrier.
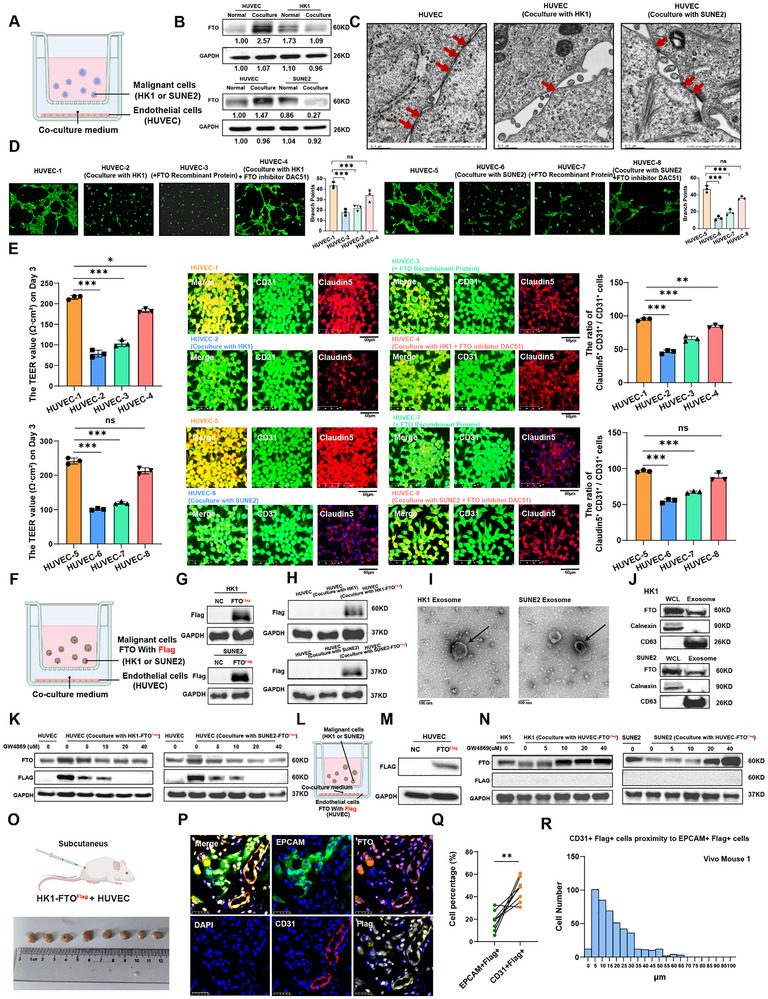
Tumor‐derived FTO proteins are secreted via exosomes and taken up by endothelial cells to modulate vascular permeability
The question moves from tumor-cell FTO expression to its effect on neighboring endothelium. A–E establish indirect co-culture and barrier-associated phenotypes; F–N use tagged proteins, vesicle characterization and inhibition to examine route and direction, and O–R investigate the tissue counterpart in vivo.
AEstablish noncontact co-culture
Schematic of the indirect co‐culture system used to study interactions between malignant cells (HK1/SUNE2) and endothelial cells (HUVECs). Physical separation tests effects that do not require direct cell contact.
BMeasure FTO in recipient endothelium
Western blot analysis of FTO expression in HUVECs, HK1, and SUNE2 cells, under cultured alone (normal) and co‐culture conditions. An FTO increase is the initial observation; the later tagging experiments investigate its origin.
CInspect junction ultrastructure
Electron microscopy showing the ultrastructure of HUVECs cell junctions under cultured alone or co‐culture conditions. Electron microscopy adds structural evidence distinct from protein-expression measurements.
DCompare co-culture, protein and inhibition
The tube formation assay showing tube‐forming ability of HUVECs under cultured alone, co‐cultured with malignant cells, added FTO recombinant protein, and co‐cultured with malignant cells treated with FTO inhibitor DAC51. The statistical results are shown on the right. Recombinant protein and DAC51 conditions probe FTO's relation to the tube-formation phenotype.
ECombine electrical and marker readouts
The values of trans‐endothelial electrical resistance (TEER) showing permeability of HUVECs under cultured alone, co‐cultured with malignant cells, added FTO recombinant protein, and co‐cultured with malignant cells treated with FTO inhibitor DAC51 in day 3 (left panel). mIHC showing the tight junction markers Claudin‐5 expression in endothelial cells (middle panel) and bar plot showing comparison of the proportion of Claudin‐5+CD31+ /CD31+ cells in different groups (right panel). TEER and Claudin-5 combine a barrier-associated functional readout with junction-marker measurements.
FTag the protein in the donor compartment
Schematic of indirect co‐culture system using Flag‐FTO malignant cells (HK1/SUNE2) to trace FTO transfer between malignant and endothelial cells. Tagging distinguishes a donor-origin signal from endothelial FTO already present in the recipient.
GValidate the tracing construct
Western blot showing Flag‐tagged FTO HK1 and SUNE2 cells were successfully constructed and verified. Confirming tagged protein in donor cells is a prerequisite for interpreting recipient signals.
HLook for the donor tag in recipients
Western blot showing after co‐culture with Flag‐FTO HK1 or SUNE2 cells, HUVEC cells showed high expression of Flag protein. Read with F–G to test whether the tumor-side tag appears in HUVECs.
IInspect isolated vesicle morphology
Negative‐staining electron microscopy showing exosomes collected from conditioned medium. Vesicle morphology is interpreted together with the marker characterization in J.
JCharacterize vesicle markers and cargo
Western blot showing the exosome positive (CD63) and negative markers (Calnexin) confirming exosome isolation from the co‐culture system and the protein expression level of FTO in exosomes from HK1 and SUNE2 cells. Positive, negative and cargo measurements serve different purposes in characterizing the isolated preparation.
KPerturb the proposed transfer route
Western blot showing FTO and Flag protein expression levels in HUVECs after the addition of the exosome inhibitor GW4869 to the co‐culture system of HUVEC cells with Flag‐FTO HK1 cells or Flag‐FTO SUNE2 cells. GW4869 tests dependence of the recipient tag and FTO signals on the proposed vesicle-associated route.
LReverse the tracing direction
Schematic of indirect co‐culture system using Flag‐FTO endothelial cells (HUVEC) to trace FTO transfer between malignant and endothelial cells. Moving the tag to the endothelial side explicitly tests the reverse direction.
MValidate the reverse-tracing donor
Western blot showing Flag‐FTO HUVECs were successfully constructed and verified. Verifying tagged HUVECs is necessary for interpreting either a positive or negative result in N.
NTest reverse transfer with inhibition
Western blot showing FTO and Flag protein expression levels in HK1 and SUNE2 cells after the addition of the exosome inhibitor GW4869 to the co‐culture system of Flag‐FTO HUVEC cells with HK1 cells or SUNE2 cells. This prevents a directional observation from being generalized to equivalent bidirectional transfer.
OEstablish the in vivo tracing model
Schematic of subcutaneous tumor models in nude mice. The diagram illustrates the injection of HK1 with Flag‐FTO (1×10⁶) and HUVEC (1×10⁶) cells into the subcutaneous space of the mouse. The photograph below shows the resulting tumor masses, aligned next to a ruler to indicate tumor size. Co-injection places the defined donor and recipient compartments in one in vivo environment.
PLocate the tag and cellular identities
mIHC showing staining of tumor tissue sections from subcutaneous tumor models with DAPI (blue) for nuclei, CD31 (red) for endothelial cells, EPCAM (green) for epithelial cells, FTO (orange) for target protein, and Flag (yellow) for target protein. The merged image illustrates the localization of these markers. EPCAM, CD31 and Flag distinguish which cell identities carry the tag within tissue.
QQuantify both compartments in paired samples
Paired dot plot compares the percentage of EPCAM+ Flag+ cells and CD31+ Flag+ cells in tumor tissue. Each line connects paired samples, highlighting the increase in cell percentage from EPCAM+ Flag+ to CD31+ Flag+ cells. Pairing compares tumor-side and endothelial-side signals within the same tissue context.
RAdd the spatial-neighborhood comparison
Bar chart showing the proximity of CD31+ Flag+ cells to EPCAM+ Flag+ cells in tumor tissue from Vivo Mouse1. Data in (D and E) are mean ± SD from 3 independent experiments, *p < 0.05 and ***p < 0.001 were determined by two‐way ANOVA with Bonferroni's post test. Proximity complements tag detection without independently proving the direction of transfer.
Takeaway
The sequence is phenotype first, protein origin second, then vesicle-route and in vivo localization tests; increased endothelial FTO alone would not establish transfer. Figure 4 next examines whether this intercellular mechanism corresponds to an alterable dissemination phenotype in vivo.
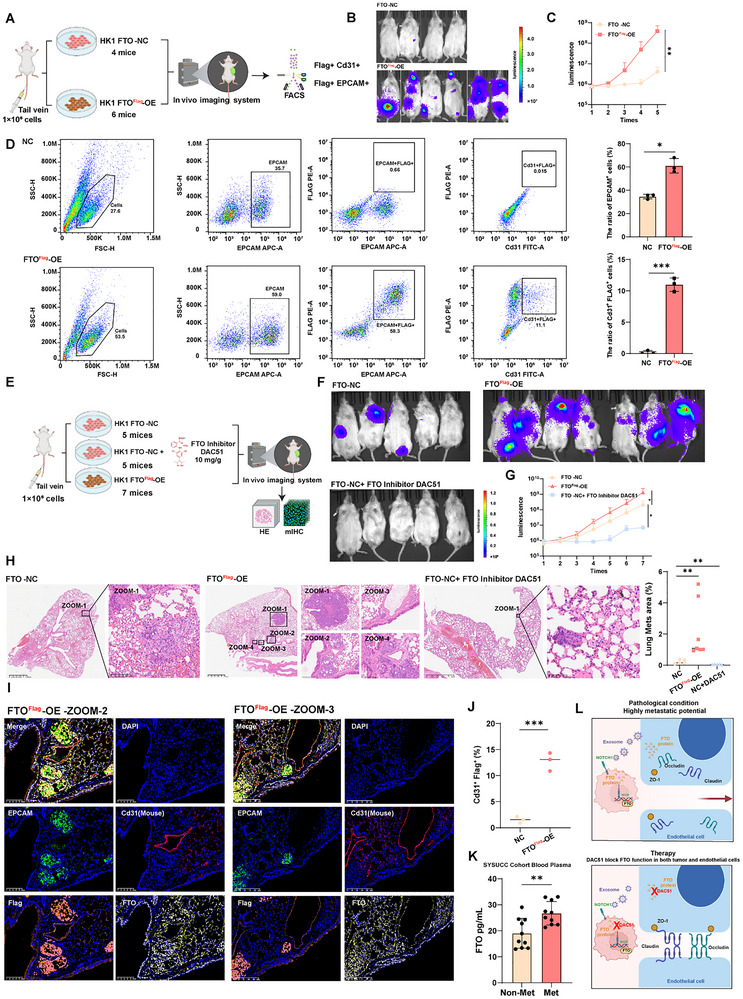
FTO regulates NPC metastatic colonization, and the FTO inhibitor DAC51 possesses anti‐tumor effects in vivo
After tracing FTO-associated endothelial effects, this figure tests their in vivo relevance. A–D examine increased FTO, E–J introduce DAC51 alongside imaging and tissue readouts, K measures a patient plasma association, and L summarizes the mechanism and intervention question at this stage.
ADefine the in vivo comparison
Flow chart depicting in vivo experiment of tail vein injection of HK1 to immunocompromised NCG mice. Control group N = 4 mice, FTO overexpression group N = 6 mice. Tail-vein injection focuses on post-injection dissemination and colonization rather than the full spontaneous metastatic cascade.
BInspect endpoint tumor-associated signals
Tumor metastasis experiment established by injecting HK1 NPC cells expressing luciferase‐GFP to NCG mice through the tail vein. Picture shows the IVIS images captured at the experiment endpoint. Inspect the representative images alongside the longitudinal quantification in C.
CTrack burden over time
Metastases growth curve indicated by luciferase signal of whole mouse detected by IVIS system for control and FTO overexpression group. The time course complements a single endpoint by showing how signal differences develop.
DAdd cell-resolved lung measurements
The number of EPCAM+ cells and Cd31+ Flag+ doublet positive cells from lung tissue in control or FTO overexpression group mice by flow cytometry (left panel). The ≈35% EPCAM+ cells reflected the high burden of these single disseminated tumor cells/micro‐metastases that are present but not easily scorable by conventional H&E histology. Summary data of cell number (right panel) are presented as mean ± SD (n = 3), *p < 0.05, ***p < 0.001; Cell-resolved flow measurements complement imaging rather than relying solely on easily visible histological lesions.
EIntroduce the pharmacologic comparison
Flow chart depicted in vivo experiment of tail vein injection of HK1 to immunocompromised NCG mice. Control group N = 5 mice, FTO inhibitor DAC51 treatment group N = 5 mice, FTO overexpression group N = 7 mice. DAC51 and increased FTO enable the subsequent readouts to compare perturbations in opposite directions.
FCompare endpoint imaging after intervention
Tumor metastasis experiment established by injecting HK1 NPC cells expressing luciferase‐GFP to NCG mice through the tail vein. Picture shows the IVIS images captured at the experiment endpoint. This provides a visual result, while the group measurements in G–J remain essential.
GQuantify the intervention time course
Metastases growth curve indicated by luciferase signal of whole mouse detected by IVIS system for control, DAC51 treatment and FTO overexpression group. A shared timeline compares how the inhibitor, control and FTO-enhanced conditions evolve.
HInspect lung histology
H&E staining of lungs dissected from the metastasis mice model of HK1 NPC cells with or without FTO overexpression or DAC51 treatment. H&E adds tissue-level evidence to the bioluminescence readout.
ICheck cellular and protein localization
mIHC images showing the expression of EPCAM (green), FTO (yellow), Cd31 (red) and Flag (orange) in xenograft tumors in different groups. The channels reconnect tumor, endothelium and tag localization with the preceding transfer mechanism.
JQuantify tag-positive endothelial cells
Bar plot showing the percentage of Cd31+ Flag+ cells in xenograft tumors from different experimental groups. Together with I, this tests whether the mechanism-associated endothelial readout varies with the intervention.
KExamine the clinical plasma association
Bar plot showing FTO protein levels in blood plasma by ELISA in the SYSUCC cohort. Patients with distant metastases N = 10, Patients without distant metastases N = 10. The clinical comparison motivates a blood-based marker hypothesis rather than establishing diagnostic performance.
LSummarize the in vivo intervention link
Schematic illustration showing FTO‐mediated endothelial disruption and therapeutic strategies involving FTO inhibitor DAC51. The model integrates preceding experiments; the next figure addresses FTO's downstream action within endothelial cells.
Takeaway
Increased FTO and pharmacologic inhibition, measured through several in vivo readouts, move FTO beyond an associated marker in these models; plasma measurements add clinical association. Figure 5 asks what FTO changes inside the recipient endothelium to alter junction status.
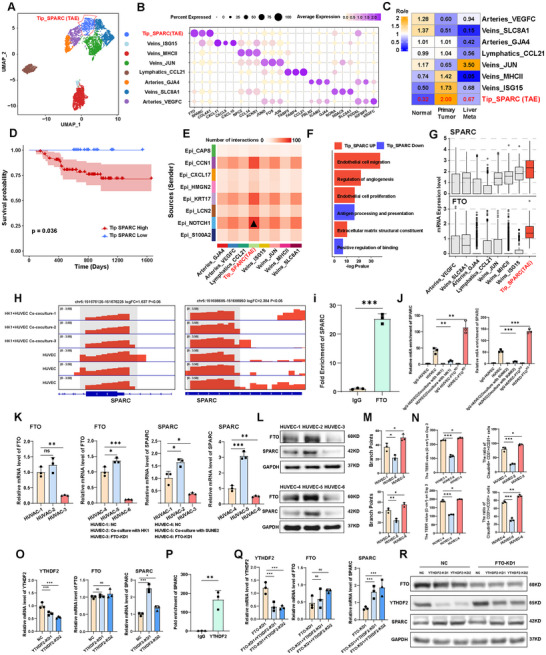
FTO disrupts endothelial integrity by promoting SPARC release in an m6A‐YTHDF2‐dependent manner
This figure asks what happens inside recipient endothelial cells. A–G nominate SPARC from endothelial states and clinical associations, H–N connect FTO, SPARC RNA m6A and barrier-associated function, and O–R use YTHDF2 binding and combined depletion to test the regulatory chain.
AMap the recipient endothelial states
UMAP plot showing the subtypes of endothelial cell, each dot indicated a single cell. Color‐coded for the cell type. The analysis shifts from tumor populations to endothelial states that may respond to the transferred signal.
BCheck endothelial subtype identities
Dot plot showing the selected markers for each subtype of endothelial cell. Dot size indicates the fraction of expressing cells and the colors represent normalized gene expression levels. Markers give the clusters in A interpretable endothelial identities.
CExamine tissue provenance
Tissue prevalence estimated by Ro/e score in endothelial cells. Tissue provenance supplies context rather than inferring metastatic relevance from the subtype name alone.
DRelate the Tip_SPARC signature to outcome
Kaplan–Meier estimation of PFS time in NPC patients by Tip_SPARC subpopulation signature score. The outcome association motivates investigation, while subsequent perturbations test functional relevance.
EMap tumor–endothelial communication candidates
Crosstalk numbers between 8 malignant epithelial subtypes and 8 endothelial subtypes. Predicted communication links candidate recipient states to the tumor compartment investigated earlier.
FInspect the candidate state's programs
Bar chart showing functional pathway enrichment analysis in Tip_SPARC subpopulation. Enrichment provides a functional rationale for examining this endothelial state in vascular phenotypes.
GCompare FTO and SPARC expression contexts
Boxplot showing SPARC and FTO mRNA expression in each subpopulation of endothelial cells. Transcript distribution is distinct from transferred protein and should be read alongside, not substituted for, the tracing experiments.
HLocate modification signals on SPARC RNA
MeRIP‐seq in HUVECs co‐cultured with malignant cells (HK1) showing the level of m6A enrichment in SPARC mRNA regions. This narrows the global m6A question to regions of the candidate transcript.
ITest FTO association with SPARC RNA
RIP‐qPCR showing the direct interaction between FTO protein and SPARC mRNA. RNA association supports a direct interaction hypothesis alongside the modification and expression experiments.
JCompare m6A enrichment after perturbation
MeRIP‐qPCR assay showing relative m6A enrichment of SPARC in HUVEC cells in IgG control, HUVEC cultured alone, HUVEC cocultured with HK1 or SUNE2, and HUVEC with FTO knockdown (KD) cultured alone. This tests whether the candidate RNA's modification state responds to co-culture or FTO perturbation.
KMeasure the transcript-level counterpart
RT‐qPCR showing relative mRNA levels for FTO and SPARC in HUVEC cells under HUVEC cultured alone (HUVEC1, HUEVC4), HUVEC cocultured with HK1 or SUNE2 (HUVEC2, HUEVC5) and HUVEC with FTO knockdown cultured alone (HUVEC3, HUEVC6). This relates modification measurements to RNA abundance while keeping the two readouts distinct.
LExtend the regulatory test to protein
Western blot showing FTO and SPARC protein levels in HUVEC cells under various experimental groupings. The groupings are identical to that in (I). Protein measurements test whether RNA-level changes correspond to accumulation of the downstream effector.
MRead the network-formation phenotype
The tube formation assay showing tube‐forming ability of HUVECs under various experimental groupings. The groupings are identical to that in (I). Tube formation asks whether the molecular experimental conditions also alter endothelial behavior.
NCombine barrier and junction measurements
TEER showing permeability of HUVECs under various experimental groupings. The groupings are identical to that in (I) (left panel). Bar plot showing comparison of the proportion of Claudin‐5+CD31+ /CD31+ cells in different groups (right panel). TEER and Claudin-5 complement M with additional integrity-associated measurements.
OIntroduce the m6A reader YTHDF2
RT‐qPCR showing the effect of YTHDF2 knockdown on the mRNA expression level of YTHDF2, FTO and SPARC. Reader depletion tests whether SPARC regulation also depends on the step that recognizes the modification.
PTest reader association with target RNA
RIP‐qPCR showing the direct interaction between YTHDF2 protein and SPARC mRNA. This links YTHDF2 perturbation to physical association with the candidate RNA.
QProbe the relationship by combined depletion
RT‐qPCR showing the effect of FTO knockdown, combined FTO and YTHDF2 knockdown conditions on the mRNA expression level of YTHDF2, FTO and SPARC. Single and combined depletion test whether the two factors participate in a connected regulatory pathway.
RRecheck combined perturbation at protein level
Western blot showing the effect of FTO knockdown, combined FTO and YTHDF2 knockdown conditions on the protein expression level of YTHDF2, FTO and SPARC. Data in (J–L and N–R) are mean ± SD from 3 independent experiments, *p < 0.05, **p < 0.01 and ***p < 0.001 were determined by two‐way ANOVA with Bonferroni's post test. Paired with Q, this connects transcript and protein responses to the combined perturbation.
Takeaway
The logic separates where SPARC is expressed, how its RNA is regulated, and how the changes correspond to endothelial phenotypes. Figure 6 then adds SPARC protein directly to test whether this downstream candidate can produce the relevant barrier-associated effects.
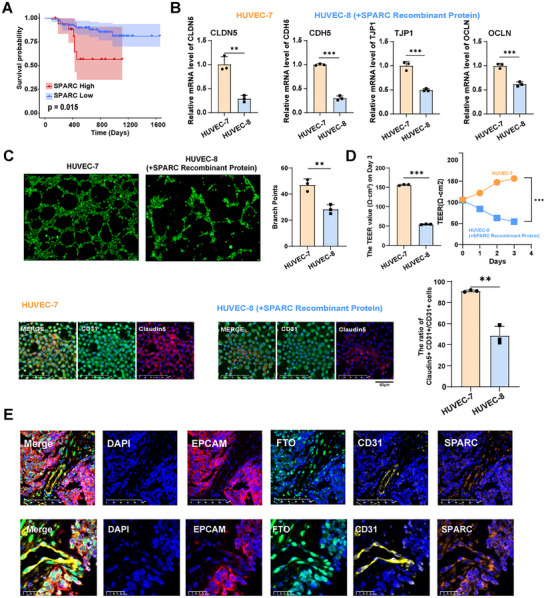
SPARC protein promotes the disruption of endothelial barriers
Having placed SPARC within the FTO–m6A–YTHDF2 pathway, this figure tests its downstream function directly. A provides clinical association, B–D examine junction genes, tube formation and barrier readouts after recombinant SPARC treatment, and E returns the molecular partners to patient tissue.
AExamine the SPARC outcome association
Kaplan‐Meier curve demonstrates that patients with high SPARC expression have a poorer prognosis. This is clinical context rather than a substitute for direct protein-treatment experiments.
BMeasure junction-gene responses directly
RT‐qPCR showing the effect of SPARC recombinant protein treatment on the mRNA expression level of CLDN5, CDH5, TJP1 and OCLN in HUVEC. Recombinant protein focuses the comparison on downstream effects of SPARC exposure itself.
CExamine network formation
The tube formation assay showing tube‐forming ability of HUVECs under HUVEC (HUVEC7) and HUVEC treated with the SPARC recombinant protein (HUVEC8). This connects transcript responses with a functional endothelial behavior.
DTest barrier changes through multiple readouts
The values of trans‐endothelial electrical resistance (TEER) showing permeability of HUVECs under HUVEC (HUVEC7) and HUVEC treated with the SPARC recombinant protein (HUVEC8). The statistical results of TEER are shown on the top. Immunofluorescence showing CD31 and Claudin‐5 expression in HUVEC‐7 and HUVEC‐8 cells (bottom panel). Bar plot comparing the proportion of Claudin‐5+CD31+ /CD31+ cells in different groups (bottom panel). Resistance, staining and quantified proportions provide complementary views of the endothelial response.
ECheck cellular and molecular tissue context
mIHC showing the expression of FTO (green), EPCAM (red), CD31 (yellow), and SPARC (orange) in NPC tissues. Data in (B–D) are mean ± SD from 3 independent experiments, *p < 0.05, **p < 0.01 and ***p < 0.001 were determined by two‐way ANOVA with Bonferroni's post test. The tissue view places the culture-based mechanism back into the clinical tumor–endothelial context.
Takeaway
Recombinant-protein experiments move from association to testing whether changing SPARC exposure changes endothelial readouts. Figure 7 integrates the resulting model from NOTCH1-positive tumor cells through intercellular FTO transfer to SPARC and vascular junctions.
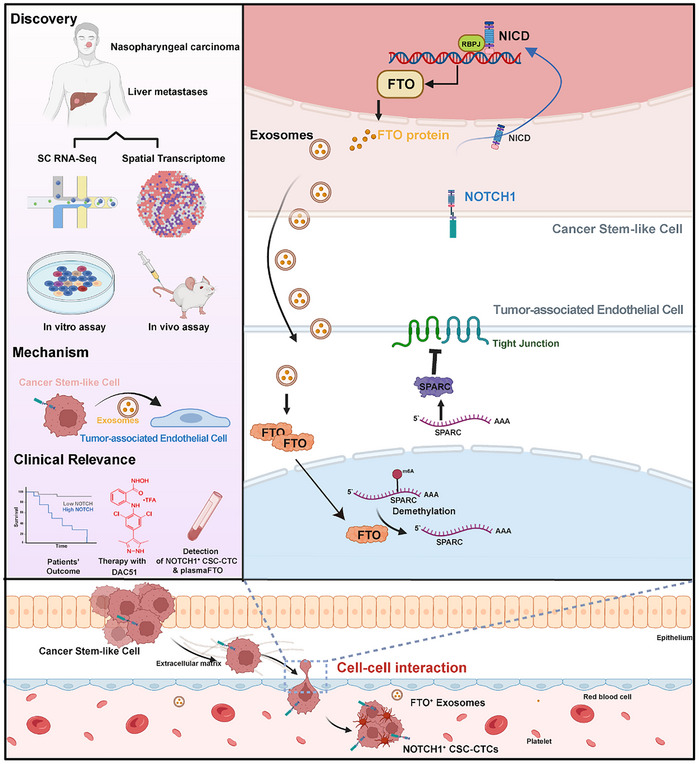
Schematic diagram of cross‐talks among cancer stem‐like cells and tumor‐assoicated endothelial cells in the TME of NPC
This unlettered schematic integrates Figures 1–6 rather than adding an independent experiment. Follow NOTCH1-positive tumor cells to FTO expression and exosomal transfer, endothelial SPARC regulation, and altered vascular junctions, linking each step back to the corresponding evidence.
Schematic diagram of cross‐talks among cancer stem‐like cells and tumor‐assoicated endothelial cells in the TME of NPC. Integrated omics analysis of matched primary and liver metastatic NPC tumors reveals a unique NOTCH1+ CSC subpopulation exhibiting enhanced stemness properties and tumorigenic capacity. With in vitro and in vivo assays, exosomal transfer of tumor‐derived FTO from NOTCH1+ cells to the endothelium promotes vascular permeability and metastatic potential. The FTO‐YTHDF2‐SPARC axis in endothelial cells induces impairment of inter‐endothelial tight junctions due to reduced m6A modification that stabilizes SPARC mRNA and increases SPARC protein abundance. The FTO inhibitor DAC51, NOTCH1+ CSC‐CTCs and plasma FTO proteins show high therapeutic and diagnostic value for NPC distant metastasis patients. (Graph created with BioRender, https://www.biorender.com/).
Takeaway
The central proposal is not simply elevated FTO in tumor cells, but an intercellular route through which it changes the endothelial environment. Blood-marker observations and DAC51 experiments represent clinical associations and preclinical tests, not established clinical utility.
My contribution
I was a coauthor and contributed to in vivo experiments.
Outcomes & record
The findings support a NOTCH1–FTO–SPARC mechanism: tumor exosomes deliver FTO to endothelium, stabilizing SPARC mRNA and disrupting tight junctions. DAC51 suppressed metastasis in mice. Published in Advanced Science (2026).