Biomed / 02
Anti-Warburg effect in CTC-mediated metastasis
Examines a potential Anti-Warburg effect during circulating tumor cell-mediated metastatic progression. Published in Aging and Disease; I am a coauthor.
- Publication status
- Published
- Journal
- Aging and Disease
Abstract
Metabolic reprogramming is a defining hallmark of cancer metastasis, warranting thorough exploration. The tumor-promoting function of the "Warburg Effect", marked by escalated glycolysis and restrained mitochondrial activity, is widely acknowledged. Yet, the functional significance of mitochondria-mediated oxidative phosphorylation (OXPHOS) during metastasis remains controversial.
Circulating tumor cells (CTCs) are considered metastatic precursors that detach from primary or secondary sites and harbor the potential to seed distant metastases through hematogenous dissemination. A comprehensive metabolic characterization of CTCs faces formidable obstacles, including the isolation of these rare cells from billions of blood cells, coupled with the complexities of ex vivo-culturing of CTC lines or the establishment of CTC-derived xenograft models (CDX). This review summarized the role of the "Warburg Effect" in both tumorigenesis and CTC-mediated metastasis. Intriguingly, bioinformatic analysis of single-CTC transcriptomic studies unveils a potential OXPHOS dominance over Glycolysis signature genes across several important cancer types.
From these observations, we postulate a potential "Anti-Warburg Effect" (AWE) in CTCs—a metabolic shift bridging primary tumors and metastases. The observed AWE could be clinically important as they are significantly correlated with therapeutic response in melanoma and prostate patients. Thus, unraveling dynamic metabolic regulations within CTC populations might reveal an additional layer of regulatory complexities of cancer metastasis, providing an avenue for innovative anti-metastasis therapies.
Read paper ↗Figures
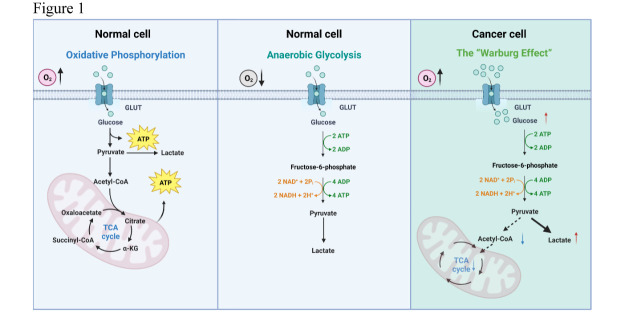
The glycolysis and mitochondrial oxidative metabolism in normal cells and cancer cells
This figure establishes the metabolic comparison used throughout the article: after glucose enters a cell, is pyruvate directed mainly toward lactate or mitochondrial oxidation? The Warburg framework provides the reference for asking whether CTCs exhibit a different relative program during circulation.
The glycolysis and mitochondrial oxidative metabolism in normal cells and cancer cells. Schematics of the distinct metabolic pathways comparing oxidative phosphorylation (OXPHOS) and anaerobic glycolysis in normal cells, and aerobic glycolysis (the “Warburg Effect”) in cancer cells. Glucose is imported by glucose transporter proteins (GLUT), after which crucial enzymes within the glycolytic pathway come into play, facilitating the transformation of glucose into pyruvate. In normal cells, under aerobic conditions, pyruvate is transformed into acetyl coenzyme A (Acetyl-CoA) and subsequently enters the tricarboxylic acid [40] cycle for mitochondria-mediated OXPHOS. In contrast, pyruvate is predominantly converted into lactate even under aerobic conditions in cancer cells. The “Warburg Effect” describes the phenomenon in cancer cells that, independent of oxygen levels, pyruvate is preferentially channeled to support the synthesis of lactate, rather than the production of Acetyl-CoA for mitochondria-mediated OXPHOS.
Takeaway
This is a conceptual pathway framework, not a direct measurement of metabolic flux in patient CTCs. Figure 2 converts the question into a transcriptomic comparison using OXPHOS and glycolysis signature scores.
The evaluation of the potential “Anti-Warburg Effect” (AWE) in CTCs
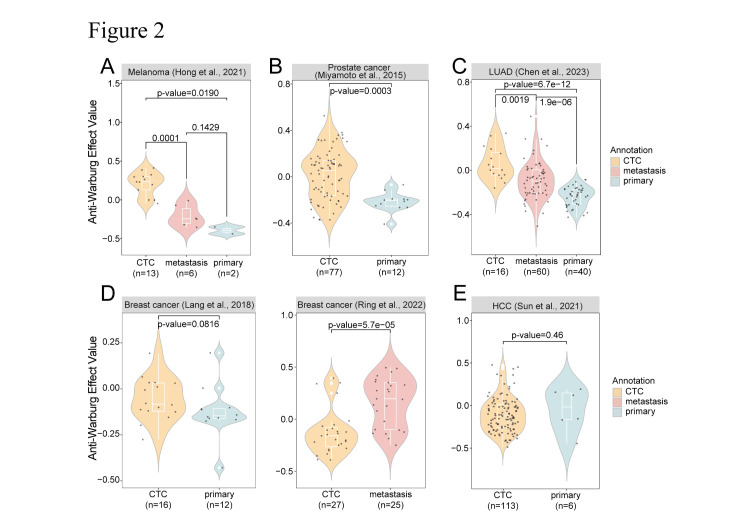
AWE is evaluated as the OXPHOS enrichment score minus the glycolysis enrichment score, comparing CTCs with tissue-derived cells across cancers. Read A–F dataset by dataset, retaining the comparator and sampling context rather than pooling them into a universal statement about cancer.
AMelanoma: compare blood and tissue
melanoma: CTC(n=13) vs metastasis(n=6): p-value=0.0001; CTC(n=13) vs primary(n=2): p-value=0.0190, Primary and metastatic comparators test the same question within different sampling contexts, including the small primary-tumor sample.
BProstate cancer: examine another cancer type
prostate cancer: CTC(n=77) vs primary(n=12): p-value=0.0003, This is a comparison in another cancer type, not additional replicates of A.
CLung adenocarcinoma: distinguish tissue comparators
lung adenocarcinoma: CTC(n=16) vs metastasis(n=60): p-value=0.0019; CTC(n=16) vs primary(n=40): p-value=6.7e-12 and Primary and metastatic comparisons separately relate the circulating state to different tissue settings.
DBreast cancer: primary-tumor dataset
Breast cancer (Lang et al., 2018): the displayed panel compares CTCs with primary-tumour cells. The figure reports P=0.0816. This is the first of two breast-cancer datasets grouped together in the published legend. This comparison does not reach the usual significance threshold and cannot be replaced by the result in E.
EBreast cancer: metastatic-tissue dataset
Breast cancer (Ren et al., 2022): the displayed panel compares CTCs with metastatic cells, with P=5.7×10⁻⁵. It is a separate dataset, not the same matched cohort as panel D. Alongside D, this presents a separate data context, not a longitudinal metabolic transition within the same patients.
FHCC: retain the nonsignificant comparison
Hepatocellular carcinoma: the displayed panel compares CTCs with primary-tumour cells, P=0.46. AWE is the HALLMARK_OXIDATIVE_PHOSPHORYLATION enrichment score minus the HALLMARK_GLYCOLYSIS enrichment score. The original text legend calls HCC panel E; the figure itself labels it F. This limits the scope of the hypothesis; transcriptomic AWE is not itself oxygen consumption or metabolic flux.
Takeaway
The comparisons motivate a difference in relative metabolic programs, while the separate breast-cancer datasets and HCC results show that the pattern is not equally significant everywhere. Figure 3 asks whether the score is also associated with treatment status.
The correlation between the “Anti-Warburg Effect” (AWE) and therapeutic response
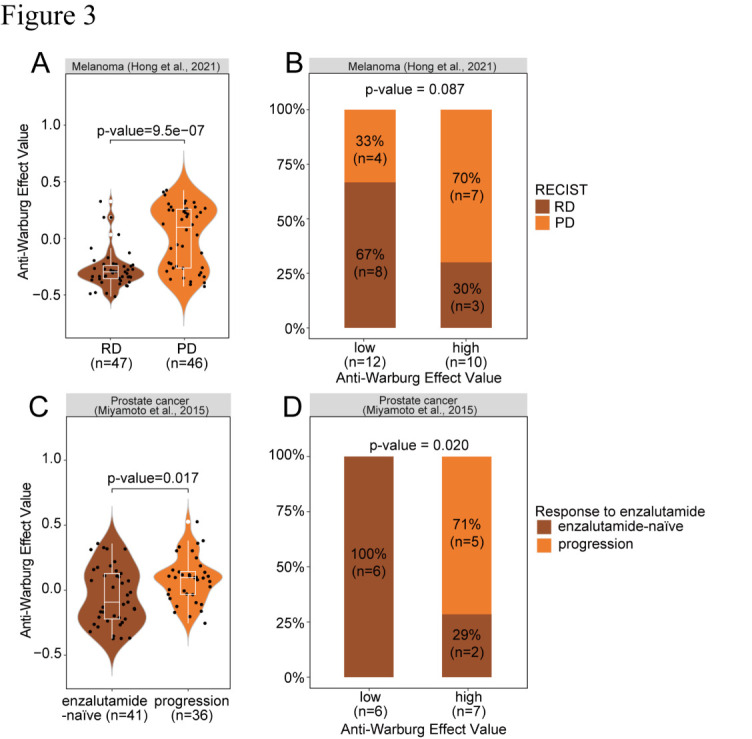
The focus shifts from tissue comparisons to treatment association. A and C compare CTC score distributions in melanoma and prostate cancer; B and D examine the relationship between high/low AWE and treatment or progression categories at the patient-group level. These analytical levels should remain distinct.
AMelanoma: cell scores and treatment status
melanoma: RD(n=47) vs PD(n=46): p-value=9.5e-07 and Compare the CTC distributions without treating every cell as a separate independent patient.
CProstate cancer: another treatment context
prostate cancer: enzalutamide-naïve(n=41) vs progression(n=36): p-value=0.017. In violin plots, each dot represents a CTC. Bar plots displayed the percentage of progression and no progression in patients with high or low AWE value in The group definitions differ from A and should retain the stated enzalutamide-naïve and progression categories.
BMelanoma: the patient-proportion comparison
melanoma: p-value=0.087 and The P=0.087 proportion comparison does not become significant because the cell-score comparison in A is significant.
DProstate cancer: relate scores to group proportions
prostate cancer: p-value=0.021. Statistical comparisons in violin plots and bar plots were accomplished using the Wilcoxon test and Fisher’s exact test, respectively. Visualization was achieved through R packages ggplot2, RColorBrewer, and ggpubr. RD: Responding on treatment as defined by RECIST1.1; Progressing on treatment as defined by RECIST1.1. This complements C as an observational association rather than a prospective prediction validation.
Takeaway
Cell-level score differences and patient-level proportion comparisons are not equivalent, particularly where the melanoma results differ in significance. They motivate treatment-related hypotheses rather than establishing individual response prediction; Figure 4 organizes the observations into a stage-dependent metabolic model.
The hypothetical model of CTC metabolic reprogramming during cancer metastasis
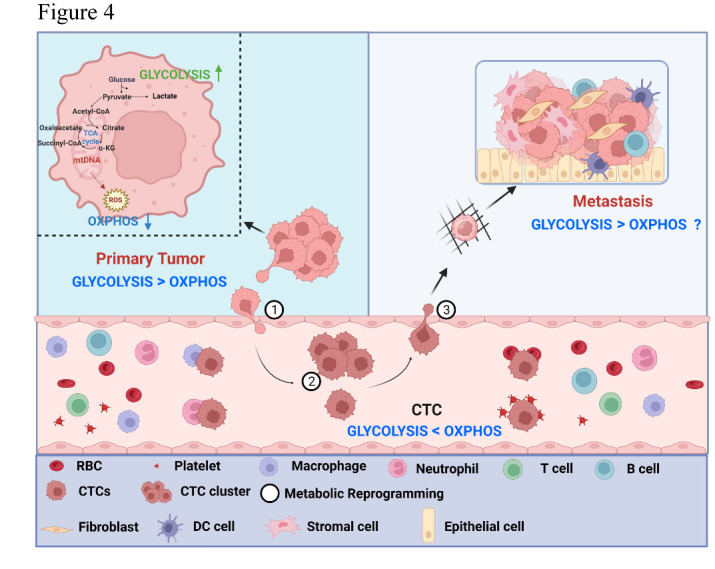
The final figure combines the conceptual framework, transcriptomic comparisons and treatment associations into a stage-dependent hypothesis. Follow the original sequence—① primary tumor, ② circulating CTCs, ③ distant sites—to consider how relative metabolic programs may change with cellular context.
The hypothetical model of CTC metabolic reprogramming during cancer metastasis. In the primary tumor (Stage ①), cancer cells may employ the “Warburg Effect” to propel cell proliferation, where glycolytic flux overtakes OXPHOS. Upon transition to CTCs (Stage ②), a metabolic shift occurs, steering towards the “Anti-Warburg effect,” characterized by an intensified mitochondrial OXPHOS activity in relation to glycolysis. This shift may potentially support CTC survival within circulation and sustaining an optimal level of ROS may be critical for their optimal viability. Upon extravasation and arrival at distant metastatic sites (Stage ③), further metabolic reprogramming might take place, likely influenced by the intricacies of the new tumor microenvironment. This metabolic adaptation and flexibility may potentially contribute to successful colonigenic outgrowth.
Takeaway
The proposal concerns metabolic adaptability rather than dividing all tumors into fixed Warburg and Anti-Warburg classes. The arrows synthesize observations into a hypothesis; testing a within-cell metabolic transition across metastatic stages requires direct temporal and functional experiments.
My contribution
I am a coauthor of this article.
Outcomes & record
Published in Aging and Disease in 2024. DOI: 10.14336/ad.2023.1227.